


ENDEAVOUR LAUNCHES CONSTRUCTION OF LAFIGUÉ PROJECT;
DFS CONFIRMS ITS POTENTIAL TO BE A CORNERSTONE ASSET
HIGHLIGHTS:
|
Abidjan, 17 October 2022 – Endeavour Mining plc (LSE:EDV, TSX:EDV, OTCQX:EDVMF) (“Endeavour” or the “Group”) is pleased to announce that it has launched the construction of its 80%-owned Lafigué Project (“Lafigué” or the “Project”) on the Fetekro property in Côte d’Ivoire, following completion of a robust Definitive Feasibility Study (“DFS”).
Sebastien de Montessus, President and CEO said: “We are very pleased to launch the construction of Lafigué as it will become another cornerstone mine for Endeavour while continuing to enhance our geographic diversification. Lafigué is expected to improve the quality of our portfolio, given its attractive production profile of approximately 200,000 ounces per year at an industry-low AISC of $871 per ounce over its initial 12.8-year mine life, with robust project economics. Moreover, we are excited by its exploration potential as we have confirmed mineralisation at several targets in close proximity to the Lafigué deposit.
We are ideally positioned to launch the construction of Lafigué, given our net cash position, the continued strong performance of our operations, and our success in de-risking the Sabadola-Massawa Expansion with a significant portion of the capital already committed on-budget. Moreover, we are seeing reduced inflationary pressures and favourable foreign exchange rates compared to earlier in the year.
In line with our capital allocation framework, we are committed to delivering strong shareholder returns in the form of dividends and share buybacks while we continue to invest in our business by pursuing the most attractive growth opportunities.”
Patrick Bouisset, Executive Vice President Exploration and Growth said: “The Lafigué discovery is a great example of how we can create significant value. For a modest exploration investment of $31 million, which represents a discovery cost of $12/oz, we have added a new cornerstone asset to our portfolio. To continue to source our projects organically, we have increased our greenfield exploration efforts, which, over recent months, have resulted in significant success at our Tanda-Iguela property in Côte d’Ivoire, where we expect to publish a maiden resource later this year.”
As summarized in Table 1 below, Lafigué is set to become another cornerstone mine for Endeavour given its alignment to the Company’s strategic targets.
Table 1: Lafigué Project Highlights
| | LAFIGUÉ | ENDEAVOUR |
| STRATEGIC TARGETS | ||
| Reserves, Moz | 2.7 | >2.0 |
| Mine life, years | 12.8 | >10 |
| Average annual production, kozpa | 203 | >200 |
| AISC, $/oz | 871 | <900 |
| After-tax NPV5%, $m1 | 477 | n.a. |
| After-tax IRR, %1 | 21 | >20 |
| 1Based on a gold price of $1,500/oz | ||
DEFINITIVE FEASIBILITY STUDY HIGHLIGHTS
Based on the DFS recommendation, an upsized 4Mtpa carbon-in-leach (“CIL”) plant capacity has been selected to process the ore from the Lafigué deposit, which will be an open pit mine. Table 2 and 3 below summarise the key operational and economic highlights.
Table 2: Lafigué DFS Highlights
| PLANT TYPE, SIZE & CAPEX | |
| Plant type | Gravity / CIL |
| Mill capacity | 4.0 |
| Upfront capital cost, $m | 448 |
| RESERVES & RESOURCES | |
| P&P Reserves, koz | 49.8Mt at 1.69 g/t for 2.7Moz |
| M&I Resources, koz | 46.3Mt at 2.03 g/t for 3.0Moz |
| Inferred Resources, koz | 1.5Mt at 2.05 g/t for 0.1Moz |
| LIFE OF MINE PRODUCTION | |
| Mine life, years | 12.8 |
| Strip ratio, W:O | 8.9 |
| Tonnes processed, Mt | 49.8 |
| Grade processed, Au g/t | 1.69 |
| Gold contained processed, Moz | 2.7 |
| Average recovery rate, % | 95 |
| Gold production, Moz | 2.6 |
| AVERAGE PRODUCTION AND COSTS | |
| Average annual production, koz | 203 |
| Cash costs, $/oz | 721 |
| AISC, $/oz | 871 |
| ENVIRONMENTAL DATA | |
| Average GHG emissions intensity1, t CO2e/oz | 0.65 |
| Average energy intensity, GJ/oz | 8.00 |
| ECONOMICS (BASED ON $1,500/oz) | |
| Pre-Tax Returns | |
| NPV5%, $m | 664 |
| IRR, % | 25 |
| Payback, years2 | 3.9 |
| After-Tax Returns | |
| NPV5%, $m | 477 |
| IRR, % | 21 |
| Payback, years2 | 4.2 |
| 1 GHG Emissions Intensity calculated as Scope 1 and 2 emissions 2 Payback period calculated starting from start of commercial production | |
Table 3: Lafigué Project Gold Price Sensitivity
| Gold Price | $1,350/oz | $1,500/oz | $1,650/oz | $1,800/oz |
| PRE-TAX | ||||
| NPV5%, $m | 391 | 664 | 905 | 1,175 |
| IRR, % | 17% | 25% | 31% | 38% |
| Payback years1 | 5.7 | 3.9 | 3.3 | 2.8 |
| AFTER-TAX | ||||
| NPV5%, $m | 267 | 477 | 662 | 870 |
| IRR, % | 14% | 21% | 27% | 33% |
| Payback years1 | 6.2 | 4.2 | 3.5 | 3.1 |
| 1 Payback period calculated from start of commercial production | ||||
As shown in Figure 1 below, the DFS demonstrates Lafigué’s ability to deliver an average of 203koz of gold per year at low all-in sustaining costs (“AISC”) of $871/oz over the life of mine, as mine plan optimisation efforts prioritised a stable, long mine life, rather than peak upfront production. Over the coming years, Endeavour will continue its exploration efforts with the goal of continuing to extend the mine life and increase annual production.
Figure 1: Lafigué DFS Production Profile
DEFINITIVE FEASIBILITY STUDY DETAILS
Endeavour expects to file a Technical Report pursuant to National Instrument 43-101 – Standards of Disclosure for Mineral Projects (“the NI 43-101”) in respect of the Lafigué DFS within a 45-day period.
Background
As shown in Figure 2 below, the Fetekro exploration permit and the associated Lafigué mining permit cover an area of 249.5km² and are situated towards the northern end of the Birimian aged Oumé-Fetekro greenstone belt, in north-central Côte d’Ivoire, approximately 500km from Abidjan by road. The Lafigué deposit is located in the northeast part of the Fetekro exploration permit. It is located next to existing infrastructure, including sealed roads and power. Endeavour has an 80% ownership stake in the Lafigué Project and 100% ownership of the remainder of the Fetekro exploration license. All major permits have been received to commence construction at Lafigué.
Figure 2: Fetekro Location Map
Endeavour began exploration on the Fetekro property in March 2017, following a strategic assessment of its exploration tenements which identified the project as a top priority target. To date, only a limited portion of the Fetekro project has been explored, as the priority has been the delineation of the Lafigué deposit. A maiden Mineral Resource Estimate for the Lafigué deposit was published on 29 October 2018 and subsequently updated on 3 September 2019, 18 August 2020, and 15 May 2022. A Preliminary Economic Assessment (“PEA”) was published on 18 August 2020 and a Preliminary Feasibility Study (“PFS”) was completed with the effective date 31 December 2020.
Given the strong exploration potential, Endeavour is targeting the discovery of 1.5 – 2.0 Moz of Indicated resources across the Fetekro exploration permit area over the 2021 and 2025 period at a discovery cost of $45/oz. Approximately 20 targets were identified by a soil geochemical sampling campaign in 2017, within 12km of Lafigué, which have received limited drilling, as shown in the Figure below. During 2022, an exploration programme of $7.0 million is planned at Fetekro, focused on expanding the Lafigué resource and on delineating 10 targets.
As shown in Figure 3 below, initial results from this year’s soil geochemical sampling and auger drilling have highlighted eight of those targets (WA01, WA03, WA08, Central Area and Targets 4, 9, 10 and 11) for follow up, with additional drilling planned. Additional Auger drilling is also planned to the southwest of the Lafigué deposit in order to test mineralised extensions of the existing resource along strike.
Figure 3: Fetekro Map with Lafigué Deposit and Nearby Targets
As shown in Figure 4 below, drilling at the Lafigué deposit, since the PFS was published, has been focused on converting Inferred resources to Indicated resources and further extending the footprint of the orebody.
Figure 4: Lafigué Geology and Pit Shell
Mineralisation has been intersected more than 440 meters below the surface or up to 900 meters down-dip at Lafigué North and as shown in the Lafigué cross section below, the deposit remains open at depth towards the south and southeast.
Figure 5: Lafigué Cross Section
Geology
The Fetekro exploration permit is located towards the northern end of the Birimian aged Oumé-Fetekro greenstone belt, a north-south trending belt comprised primarily of bimodal metavolcanics and clastic metasedimentary rocks.
The area around the Lafigué deposit is a Birimian aged volcanic complex predominately composed of mafic volcanic and intrusive rocks, with felsic intrusives in the western extent of the deposit. The volcanic complex has been affected by transpressive deformation and intruded by granodioritic bodies and quartz-porphyry dykes.
Gold mineralisation at Lafigué is primarily controlled by an east-northeast trending brittle-ductile thrust fault dipping at between 15° to 45° towards the south-southeast. The gold mineralisation occurs as free gold in quartz vein stockworks and in silicified zones, often associated with tourmaline, calcite, ankerite and pyrite. The alteration assemblage comprises biotite-sericite-tourmaline-chlorite-carbonate and up to 5% disseminated pyrite and pyrrhotite.
Reserves and Resources
The DFS is based on the updated Mineral Resource Estimate (“MRE”), effective as of 15 May 2022, as shown in Table 4 below, which has a high resource to reserve conversion ratio of 90%.
Table 4: Lafigué Updated Mineral Reserves and Resources
| On a 100% basis. M&I Resources shown inclusive of Reserves. | Tonnage | Grade | Content |
| (Mt) | (Au g/t) | (Au koz) | |
| Proven Reserves | - | - | - |
| Probable Reserves | 49.8 | 1.69 | 2,714 |
| P&P Reserves | 49.8 | 1.69 | 2,714 |
| Measured Resource (incl. reserves) | - | - | - |
| Indicated Resources (incl. reserves) | 46.3 | 2.03 | 3,027 |
| M&I Resources (incl. reserves) | 46.3 | 2.03 | 3,027 |
| Inferred Resources | 1.5 | 2.05 | 102 |
Mineral Resource Estimate effective as of 15 May 2022 (“2022 Resources”). Mineral Reserve Estimate effective as of 1 June 2022 (“2022 Reserves”). Mineral Resource and Reserve Estimates follow the Canadian Institute of Mining, Metallurgy and Petroleum ("CIM") Definitions Standards for Mineral Resources and Reserves and have been completed in accordance with the Standards of Disclosure for Mineral Projects as defined by National Instrument 43-101. Reported tonnage and grade figures have been rounded from raw estimates to reflect the relative accuracy of the estimate. Minor variations may occur during the addition of rounded numbers. Mineral Resources that are not Mineral Reserves do not have demonstrated economic viability. Resources were constrained by MII Pit Shell and based on a cut-off grade of 0.4 g/t for oxide ore and 0.5 g/t for transitional and fresh ore and a $1,500/oz gold price. Reserves are based on a cut-off grade of 0.4 g/t gold and $1,300/oz gold price for all material types. The Qualified Person for the Mineral Resources is Dr Lucy Roberts, Principal Consultant - Resource Geology with SRK. The Qualified Person for Mineral Reserves is Francois Taljaard, Principal Consultant - Mining Engineering with SRK.
Mining Operations
The Lafigué deposit is a near surface ore body amenable to conventional open-pit, drill and blast mining, which will be carried out by contractors. The Lafigué open pit will be developed in six stages with a maximum mining capacity of 55Mt per year.
Mining will occur in 10-meter benches, with double batters to achieve the final 20-meter bench heights. Ore mining will occur in three to four flitches, selectively using smaller loading equipment in order to decrease dilution.
Diesel excavators and trucks will be used for loading and haulage, with a fleet comprising 400 tonne class face shovels to load 180 tonne capacity dump trucks for waste mining, and 200 tonne class excavators to load 180 tonne capacity dump trucks for ore mining.
Processing Operations
Ore will be processed via a 4.0 Mtpa processing plant based on only a fresh ore feed. Over the life of mine, the plant will be fed with 94.2% fresh ore and 5.8% oxide and transitional ore with the proportion of oxide and transitional ore remaining below 30% at any time.
A two-stage crushing followed by high-pressure grinding roll and ball milling circuit is planned. A primary jaw crusher will crush ore to a coarse crush size, followed by secondary cone crusher which will produce an intermediate crushed product where 80% passes 25mm. This will feed to a crushed ore stockpile that feeds the high-pressure grinding roll circuit. Ore will then be passed through a conventional ball mill and milled to 80% passing 106µm (microns).
The milled ore will pass through a gravity circuit for separation and recovery of coarse free gold, to produce a gravity concentrate for cyanidation and electrowinning that can be smelted to produce gold doré. High gravity recovery of approximately 70% is estimated for fresh ore at Lafigué.
The remaining milled ore will be screened and passed to a carbon-in-leach (“CIL”) circuit containing one pre-leach tank and six CIL tanks in series for leaching and adsorption. Leach residence time will be approximately 36 hours. Following leaching and adsorption gold will be recovered from activated carbon by elution, electrowinning and gold smelting to produce gold doré.
Extensive and representative metallurgical testwork has indicated that gold is free milling with very high gravity and leach extraction potential, with a projected gold recovery rate of 95% over the life of mine.
Infrastructure
The Project benefits from good infrastructure in close proximity to site, and a limited relocation requirement as there are no villages on the site, in addition early works have focused on advancing the site infrastructure to facilitate a smooth transition into construction. Site roads to the mine from the national road network, the 24km mine perimeter fence, the mine’s airstrip and the earthworks for the construction camp have already been completed as part of the early works for a cost of $6 million, incurred during the first six months of 2022.
Furthermore, new infrastructure will be added to support mining, processing and waste management on the mining license including 6.6km of internal roads, a 32km power transmission line, emergency diesel generators, and additional site facilities and accommodation for staff. In addition, space has been allocated to the north of the existing processing plant, to potentially incorporate a solar power facility in the future.
Lafigué is located in a low water stress area, and consequently water for operations will be sourced primarily from a water harvest dam that collects annual rainfall and pumps to a water storage dam, which will be supplemented with collected ground water. Power will be drawn from the national electricity grid via a 225kV switchyard in Dabakala, connecting to a new 32km 225kV transmission line. The project will have a total connected load of 27.5MW.
The tailings storage facility (“TSF”) was designed by Knight Piésold to ANCOLD guidelines (ANCOLD, 2019), and the final design will be in compliance with the Global Industry Standard on Tailings Management (“GISTM”) guidelines. The TSF will have a high-density polyethylene (“HDPE”) liner and downstream raise construction methods will be utilised for all nine of the TSF embankment raises.
The TSF will comprise a cross-valley storage facility, comprising a total footprint area of approximately 113ha for Stage 1, increasing to 175ha for the final stage. Stage 1 is designed to accommodate 11.0Mt of tailings equivalent to 36 months of storage capacity. The final TSF is designed to accommodate a total of 41.0Mt of tailings, with additional scope to be expanded to accommodate up to 80.0Mt. The TSF will be monitored on an ongoing basis by groundwater monitoring stations downstream of the dam, standpipe piezometers and survey pins, and the TSF will be subject to independent annual audits.
Operating Cost Summary
Operating cost estimates have been compiled by Lycopodium. Mining operating cost estimates, prepared by SRK with input from Endeavour, are based on a small owner’s team managing mining activities using a contract-mining model. Process, Infrastructure and General and Administration (“G&A”) operating cost estimates were prepared by Lycopodium with input from Endeavour. Life of mine operating unit costs are summarised in the table below.
Table 5: Life of Mine Operating Unit Costs (+/- 15%)
| UNIT COSTS | |
| Open Pit Mining & Rehandling | $2.57/t mined |
| Processing | $11.59/t processed |
| G&A | $4.72/t processed |
Operating costs have been based on a delivered diesel price of $0.91 per litre. Power will be sourced from the national grid service provider, CI-Energies, with power costs estimated at $0.112/kWh.
Capital Cost Summary
The project capital cost estimate was compiled by Lycopodium with input from Knight Piésold on the TSF, water infrastructure and site access roads. Endeavour has provided estimates for mine establishment, infrastructure facilities, high voltage power supply and owner’s costs. The initial capital costs, which includes a 10% contingency, are summarised in the table below.
Table 6: Lafigué Capital Cost Estimate Summary (+15/-5%)
| CAPITAL COSTS ($M) | |
| Treatment Plant | 75.9 |
| Reagents and Services | 20.6 |
| Infrastructure | 74.7 |
| Mining Facilities and Establishment | 21.5 |
| Construction Distributables | 36.3 |
| Management Costs | 33.3 |
| Owners Project Costs | 71.9 |
| Freight | 26.4 |
| Tax and Duties | 5.6 |
| Contingency | 43.0 |
| SUBTOTAL | 409.2 |
| Upfront Working Capital | 38.8 |
| TOTAL | 448.0 |
Foreign exchange rates of 0.87 for USD:EUR, 550 for USD:XOF, 1.30 for USD:AUD and 0.70 for USD:GBP have been used to determine capital cost and operating cost estimates. Owner Project Costs of $72 million include pre-production plant and administrative costs, and plant mobile equipment costs. Pre-production activities associated with mining result in a $39 million pre-production working capital outflow, which has been included in the initial capital cost estimate.
Capital costs will be wholly funded by Endeavour. Growth capital spend for the Project is expected to be circa $60 million for 2022, with the remainder more heavily weighted towards H2-2023 and H1-2024.
As shown in Figure 6 below, the ROM pad and process plant will be located adjacent to the northwestern end of the Main Pit, while the TSF will be located on the western extent of the site.
Figure 6: Schematic Lafigué Site Layout
Environmental and Social
The environmental permit for the Project was received on 18 February 2021 and an Environmental and Social Management Plan (“ESMP”) is being implemented to guide Endeavour’s local community engagement as well as ensuring it fulfils its environmental obligations, minimising the mine’s impacts where possible. The ESMP will be used to ensure compliance with environmental specifications, monitoring and management measures and will be implemented from site preparation through to decommissioning and closure. Monitoring plans will be based on the ESMP. A total of $24 million has been provisioned into the economic model for the closure activities after mining and processing activities have ceased.
Endeavour supports the development of local talent and is targeting over 90% of its skilled, technical, professional and management workforce to be Ivorian nationals, as well as targeting 20% female representation in the workforce. Furthermore, the Endeavour foundation has initiated two partnerships, focused on developing local talent. The first, in partnership with the Ministry of National Education and Literacy of Côte d'Ivoire, aims to provide literacy programmes to 500 young people and women from local communities. The second, in partnership with the Ministry of Technical Education, Vocational Training and Apprenticeship of Côte d'Ivoire, aims to improve the technical skills of 150 young people from local communities, through training and certification in construction trades.
During construction activities, approximately 1,100 employees will be onsite. During operating activities, the team will consist of 380 Endeavour employees with a total of 1,551 employees and contractors.
Ownership, Permitting, Taxes and Royalties
Endeavour has an 80% ownership stake in Lafigué, while SODEMI (the Ivorian state-owned mining company) and the Government of Côte d’Ivoire each have a 10% stake. In addition, Endeavour has full ownership of the remainder of the Fetekro exploration license until it is converted into a mining license.
The environmental permit for the Lafigué Project was received on 18 February 2021 and the exploitation license was received on 22 September 2021, as such all major permits have been received to commence construction at Lafigué.
A corporate tax rate of 25% of gross profit has been applied in the DFS. A royalty rate of 4.0% and 0.5% contribution to the Local Mining Development Fund was applied to all sales. A transport and refining charge of $2.90/oz Au was also applied.
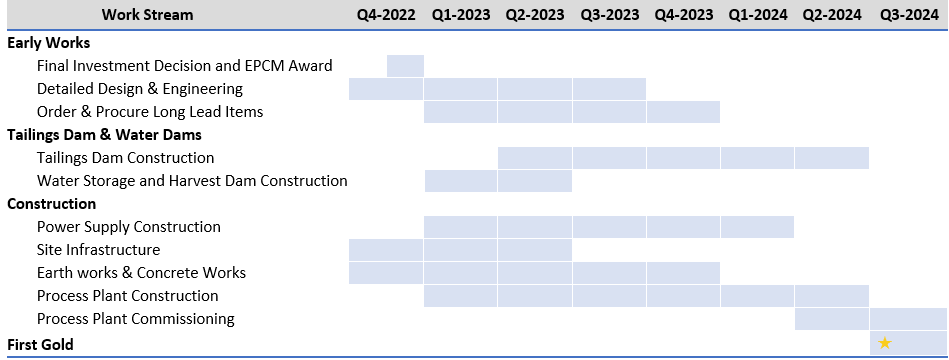
Timetable to First Gold Pour
A 22-month construction period is projected from the initial investment decision to the first gold pour in early Q3-2024.
As shown below in Figure 7, early works and detailed engineering have already commenced. The air strip and the main access road construction have been completed, and earthworks for the construction camp and the processing plant are underway. Contracts have been awarded to the EPCM contractor, the bulk earthworks contractor, milling and grinding packages, and for the power transmission line.
Power line and water dam construction are expected to commence in Q4-2022. The TSF and process plant construction activities are scheduled to commence in Q1-2023, with the process plant commissioning expected in H1-2024 and the first gold pour expected in Q3-2024.
Figure 7: Lafigué Project Timeline
2022 DFS vs 2020 PFS
As shown in the table below, the key changes from the 2020 PFS to the 2022 DFS are due to the increased resource size and the selection of an increased plant throughput capacity of 4.0Mtpa.
Table 7: Lafigué DFS vs PFS Highlights
| DFS | PFS | DFS VS PFS | |
| PLANT TYPE, SIZE & CAPEX | |||
| Plant type | Gravity / CIL | Gravity / CIP | |
| Mill capacity | 4.0 | 3.0 | +33% |
| Upfront capital cost, $m | 448 | 338 | +33% |
| RESERVES & RESOURCES | |||
| P&P Reserves, koz | 2,714 | 2,100 | +29% |
| M&I Resources, koz | 3,027 | 2,471 | +23% |
| Inferred Resources, koz | 102 | 66 | +55% |
| LIFE OF MINE PRODUCTION | |||
| Mine life, years | 12.8 | 9.5 | +34% |
| Strip ratio, W:O | 8.9 | 10.3 | -14% |
| Tonnes processed, Mt | 49.8 | 31.9 | +56% |
| Grade processed, Au g/t | 1.69 | 2.05 | -18% |
| Gold contained processed, Moz | 2.7 | 2.1 | +29% |
| Average recovery rate, % | 95 | 95 | - |
| Gold production, Moz | 2.6 | 2.0 | +30% |
| AVERAGE PRODUCTION AND COSTS | |||
| Average annual production, kozpa | 203 | 209 | -3% |
| Cash costs, $/oz | 721 | 684 | +5% |
| AISC, $/oz | 871 | 838 | +4% |
| ENVIRONMENTAL DATA | |||
| GHG Emissions Intensity1, t CO2e/oz | 0.65 | 0.36 | +81% |
| Energy Intensity, GJ/oz | 8.00 | 6.99 | +14% |
| ECONOMICS (BASED ON $1,500/oz) | |||
| Pre-Tax Returns | |||
| NPV5%, $m | 664 | 663 | - |
| IRR, % | 25 | 38 | (34)% |
| Payback, years2 | 3.9 | 2.6 | +50% |
| After-Tax Returns | |||
| NPV5%, $m | 477 | 479 | - |
| IRR, % | 21 | 33 | (36)% |
| Payback, years2 | 4.2 | 2.7 | +56% |
| 1 GHG Emissions Intensity calculated as Scope 1 and 2 emissions 2 Payback period calculated starting from start of commercial production | |||
As illustrated in the graph below, Lafigué’s mine life has been extended by 3.3 years, while its average annual production and cost profile has remained similar, as mine plan optimisation efforts prioritised a stable long mine life rather than peak upfront production.
Figure 8: Lafigué DFS vs PFS Production Profile
As shown in Table 8 below, the 2022 Probable mineral reserves have increased by 0.6Moz compared to the 2020 reserves, and the resource to reserve conversion ratio has increased from 85% to 90%.
Table 8: Lafigué Mineral Reserves and Resource
| 2022 | 2020 | VARIANCE | |||||||
| On a 100% basis. M&I Resources shown inclusive of Reserves. | Tonnage | Grade | Content | Tonnage | Grade | Content | Au Content | ||
| (Mt) | (Au g/t) | (Au koz) | (Mt) | (Au g/t) | (Au koz) | (Au koz) | |||
| Proven Reserves | - | - | - | - | - | - | - | ||
| Probable Reserves | 49.8 | 1.69 | 2,714 | 31.9 | 2.00 | 2,100 | +614 | ||
| P&P Reserves | 49.8 | 1.69 | 2,714 | 31.9 | 2.00 | 2,100 | +614 | ||
| Measured Resource (incl. reserves) | - | - | - | - | - | - | - | ||
| Indicated Resources (incl. reserves) | 46.3 | 2.03 | 3,027 | 32.0 | 2.40 | 2,471 | +556 | ||
| M&I Resources (incl. reserves) | 46.3 | 2.03 | 3,027 | 32.0 | 2.40 | 2,471 | +556 | ||
| Inferred Resources | 1.5 | 2.05 | 102 | 0.8 | 2.52 | 66 | +36 | ||
The DFS is based on a Mineral Resource Estimate that is effective as of 15 May 2022 (“2022 Resources”) and the Mineral Reserve Estimate that is effective as of 1 June 2022 (“2022 Reserves”). The PFS was based on the Mineral Resource Estimate effective as of 18 August 2020 (“2020 Resources”) and the Mineral Reserve Estimate effective as of 31 December 2020 (“2020 Reserves”). Mineral Resource and Reserve Estimates follow the Canadian Institute of Mining, Metallurgy and Petroleum ("CIM") Definitions Standards for Mineral Resources and Reserves and have been completed in accordance with the Standards of Disclosure for Mineral Projects as defined by National Instrument 43-101. Reported tonnage and grade figures have been rounded from raw estimates to reflect the relative accuracy of the estimate. Minor variations may occur during the addition of rounded numbers. Mineral Resources that are not Mineral Reserves do not have demonstrated economic viability. 2022 resources were constrained by MII Pit Shell and based on a cut-off grade of 0.4 g/t for oxide ore and 0.5 g/t for transitional and fresh ore and a $1,500/oz gold price. 2020 Resources were constrained by MII Pit Shell and based on a cut-off grade of 0.5 g/t gold and $1,500/oz gold price. 2022 Reserves are based on a cut-off grade of 0.4 g/t gold and $1,300/oz gold price for all material types, while 2020 Reserves are based on a cut-off grade of 0.4-0.6 g/t gold depending on the ore type and a $1,500/oz gold price. The Qualified Person for the 2020 Mineral Resources is Kevin Harris CPG, VP Resources. The Qualified Person for the 2022 Mineral Resources is Dr Lucy Roberts, Principal Consultant - Resource Geology with SRK. The Qualified Person for the 2020 Mineral Reserves is Allan Earl, Executive Consultant with Snowden and the Qualified Person for the 2022 Mineral Reserves is Francois Taljaard, Principal Consultant - Mining Engineering with SRK.
The 2022 Resource grade is lower than that of the 2020 Resource, as lower grade resources (with a lower associated strip ratio) were delineated in the southwest portion of the Lafigué deposit. In addition, more conservative modelling assumptions were used by SRK Consulting in preparing the resource model, notably with implicit modelling based on a broader mineralised interpretation and using a lower grade of 0.30 g/t to define the mineralised wireframe limits. The 2022 Reserve model also incorporates a more conservative modelling approach, whereby additional dilution of 10% was applied to zones of oxide and transitional ore, in addition to applying a buffer around zones where there has been historical artisanal mining.
As shown in the table below, capital costs increased from $338 million in the PFS to $448 million. Scope additions related to the increase in plant capacity represent an increase of approximately $51 million, while cost increases related to inflation represent an increase of $43 million and increased owner costs represent an increase of $42 million. Total savings of $26 million have been identified, through initiatives such as buying an unused second-hand construction camp.
Table 9: Lafigué DFS - PFS Capital Cost Bridge
| CAPITAL COSTS ($M) | |
| PFS CAPEX | 338 |
| Scope changes and other | +51 |
| Inflationary impacts | +43 |
| Increased owner’s costs | +42 |
| Savings | (26) |
| DFS CAPEX | 448 |
LAFIGUÉ TECHNICAL NOTES
2022 Mineral Resource Estimate
The statistical analysis, geological modelling and resource estimation were prepared by a team of consultants from SRK Consulting (UK) Ltd. The Qualified Person as defined by National Instrument 43-101 - Standards of Disclosure for Mineral Projects ("NI 43-101") is Dr Lucy Roberts, Principal Consultant - Resource Geology with SRK.
The Lafigué mineral resource model was developed in Seequent’s Leapfrog Geo software. The database used to generate the Mineral Resources comprised some 1,892 drillholes, with a total drilling of 286,087 meters. The majority of the available drillhole data (post-2010) was supported by industry standard quality assurance and quality control systems, with quality control sampling comprising blanks, coarse blanks, certified reference materials, and field and pulp duplicates. SRK has reviewed the QAQC data available and considers the assay data to be suitable for use in the subsequent Mineral Resource estimate.
Mineralisation domains were modelled implicitly, using an indicator interpolant for areas of wider, more continuous mineralisation, and vein wireframes for zones of less continuous mineralisation. The gold assays from the drill holes were composited to 1 meter intervals. Capping varied depending on the mineralised domain, between no cap and 27 g/t. Spatial analysis of the gold distribution within the mineralised zone indicated moderate continuity of the grades along strike and down dip within the mineralised zones. Variogram ranges in the direction of maximum continuity were between 38 meter and 75 meter.
Density measurements from 236 drillholes and covering each of the lithologies, were averaged based on the material type (and lithology, in the case of fresh material). Average density values were applied to the associated portions of the block model as outlined below:
- Laterite: 2.00 g/cm3
- Saprolite: 1.66 g/cm3
- Saprock: 2.51 g/cm3
- Fresh – Mafic: 2.86 g/cm3
- Fresh – Felsic: 2.72 g/cm3
Gold grades were estimated using Ordinary Kriging for most of the modelled mineralisation. Where it was not possible to define a well-structured variogram for the smallest domains with low sample support, an Inverse Distance Squared (“IDW2”) estimator was used. The grade was estimated in multiple passes to define the higher confidence areas and extend the grade to the interpreted mineralised zone extents.
The grade estimation was validated with visual and statistical analysis, and comparison with the drilling data on sections with swath plots comparing the block grades with the composites.
SRK considers that the quality and spatial distribution of the data used, the geological continuity of the mineralisation and the quality of the estimated block model for Lafigué deposit is sufficient for the reporting of Indicated and Inferred mineral resources, in accordance with the CIM Definition Standards. Indicated mineral resources have typically been defined in areas with a drillhole spacing of 20-40 meters along sections, and 40-50 meters between sections, where there is a reasonable level of confidence in geological and grade continuity. Inferred mineral resources have typically been defined in areas with a drillhole spacing of 50 to 75 meters, and where the controls on mineralisation are less well understood, or the continuity is much reduced.
Given artisanal mining is known to have occurred at Lafigué, SRK has estimated the depletion and applied this to the Mineral Resources reported. SRK considers that an estimated 76,000 ounces has been removed due to artisanal mining activities. A drone survey was conducted on 17 August 2021 and covered the full extent of the area impacted by artisanal mining. The drone survey identified the largest areas which had been mined using open pit methods, with pits of up to 10 to 15 meters deep being observed; however it was not of sufficient resolution to accurately deplete all small-scale surface workings. In addition, the grades of mineralised material within 5 meters of the pre-mining topographic surface (dated 2015), have been reduced to zero. The 5 meter depth assumption is based on observations by Endeavour personnel in the field. This area remains a risk to the Mineral Resource and requires further detailed investigation as part of the next phase of study.
Mineral resources are reported within an optimised pit shell using gold cut-off of grades of 0.4 g/t for oxide ore; 0.5 g/t for transitional ore and 0.5 g/t for fresh ore, which reflect the marginal cut-off grades for CIL processing determined during the pit optimisation. Technical and economic assumptions were agreed between SRK and Endeavour for mining factors (mining and selling costs, mining recovery and dilution, pit slope angles) and processing factors (gold recovery, processing costs), which were used for optimisation. These factors were developed as part of the Definitive Feasibility Study for the Lafigué project, as summarised below:
- Ore mining cost: $2.12/t
- Waste mining cost: $2.65/t
- Processing cost: Oxide and transitional ore: $7.47/t, fresh ore: $9.13/t
- Selling cost: $71.8/oz of gold
- Mining recovery: 98%
- Mining dilution: 9%
- Processing recovery: Varies dependent on head grade. Averages 95% for each of the three material types
- Average slope angles: 33 - 51°, dependent on geotechnical domain
- G&A cost: $5.60/t
2022 Mineral Reserves Estimate
The Qualified Person as defined by National Instrument 43-101 - Standards of Disclosure for Mineral Projects ("NI 43-101") is Francois Taljaard, Principal Consultant - Mining Engineering with SRK.
The mineral reserve estimate has been updated for the Lafigué Project, based on the updated resource model. Probable mineral reserves of 49.8 Mt at 1.7 g/t Au for 2.7Moz are based on a $1,300/oz gold price assumption. For the reserve estimation, a cut-off grade of 0.4 g/t gold was applied for all material types. The mineral reserves were associated with 441.8 Mt of waste, which corresponds to a stripping ratio of 8.9:1.0 waste to ore mass.
Based on the DFS results, the mining method will be conventional open pit mining including drilling, blasting, loading and hauling. It is anticipated that all the mining activities will be undertaken using a contract mining model.
Ore mined will be hauled to the ROM pad and stockpiles. Waste mined from the pit will be hauled to the waste dumps and other projects requiring waste material for construction (i.e. tailing storage facility, haul roads etc.).
The 2019 Lafigué Metallurgical tests included a total of 36 variability samples and 12 comminution composite samples representative of the mineral reserve.
The metallurgical variability test work focused on gravity gold recovery with cyanidation of the gravity tail. Gold recoveries were high from all facies with between 30% and 85% gravity gold recovery and overall gold extractions above 95%.
The comminution tests focused on the determination of the abrasion index, and bond rod and ball work index. The purpose of the test programme was to determine the ore physical characteristics to allow modelling of the grinding energy required for size reduction to facilitate a crushing and milling circuit design appropriate for the plant throughput and feed type.
Based on the updated plant design, the processing plant at Lafigué will comprise of a CIL plant with a nameplate capacity of 4.0Mt per annum with primary and secondary crushing, followed by a high-pressure grinding roll and ball milling circuit to produce an 80% passing 106-micron grind size.
Ground fresh ore will be fed to continuous centrifugal gravity concentrators to recover free gold to a low mass gravity concentrate. This gravity concentrate is processed through an intensive cyanide leach reactor followed by electrowinning to recover the gold.
Classifying cyclone overflow will be thickened and fed into a standard leach-CIL circuit, with CIL tails passing into a thickener to recover process water before being pumped to the TSF.
These factors were developed as part of the DFS for the Lafigué project, as summarised below:
- Reserve gold price: $1,300/oz
- Average mining cost of ore mined: $2.03/t oxide, $2.09/t transitional and $3.16/t fresh ore
- Average processing cost: $9.34/t oxide, $9.34/t transitional and $11.00/t fresh ore
- G&A cost per tonne mined: $5.60/t
- Processing recovery 95%
- Royalties and community levy at $1,500/oz gold price: 4.5%
- Refinery, Transport & Security: $4.0/oz
- Discount rate: 5%
- Dilution: 5% except the areas affected by the artisanal miners, where 10% dilution was applied on oxide and transitional ore
QUALIFIED PERSONS
Other than with respect to the mineral resource and reserve estimates, Mark Morcombe, COO of Endeavour Mining plc., a Fellow of the Australasian Institute of Mining and Metallurgy, is a "Qualified Person" as defined by National Instrument 43-101 - Standards of Disclosure for Mineral Projects ("NI 43-101") and has reviewed and approved the technical information in this news release.
CONTACT INFORMATION
| Martino De Ciccio VP – Strategy & Investor Relations +44 203 640 8665 mdeciccio@endeavourmining.com | Brunswick Group LLP in London Carole Cable, Partner +44 7974 982 458 ccable@brunswickgroup.com |
ABOUT ENDEAVOUR MINING CORPORATION
Endeavour Mining is one of the world’s senior gold producers and the largest in West Africa, with operating assets across Senegal, Cote d’Ivoire and Burkina Faso and a strong portfolio of advanced development projects and exploration assets in the highly prospective Birimian Greenstone Belt across West Africa.
A member of the World Gold Council, Endeavour is committed to the principles of responsible mining and delivering sustainable value to its employees, stakeholders and the communities where it operates. Endeavour is listed on the London and Toronto Stock Exchanges, under the symbol EDV.
For more information, please visit www.endeavourmining.com.
CAUTIONARY NOTE REGARDING FORWARD-LOOKING INFORMATION
This news release contains "forward-looking statements" including but not limited to, statements with respect to Endeavour's plans and operating performance, the estimation of mineral reserves and resources, the timing and amount of estimated future production, costs of future production, future capital expenditures, and the success of exploration activities. Generally, these forward-looking statements can be identified by the use of forward-looking terminology such as "expects", "expected", "budgeted", "forecasts", and "anticipates". Forward-looking statements, while based on management's best estimates and assumptions, are subject to risks and uncertainties that may cause actual results to be materially different from those expressed or implied by such forward-looking statements, including but not limited to: risks related to the successful integration of acquisitions; risks related to international operations; risks related to general economic conditions and credit availability, actual results of current exploration activities, unanticipated reclamation expenses; changes in project parameters as plans continue to be refined; fluctuations in prices of metals including gold; fluctuations in foreign currency exchange rates, increases in market prices of mining consumables, possible variations in ore reserves, grade or recovery rates; failure of plant, equipment or processes to operate as anticipated; accidents, labour disputes, title disputes, claims and limitations on insurance coverage and other risks of the mining industry; delays in the completion of development or construction activities, changes in national and local government regulation of mining operations, tax rules and regulations, and political and economic developments in countries in which Endeavour operates. Although Endeavour has attempted to identify important factors that could cause actual results to differ materially from those contained in forward-looking statements, there may be other factors that cause results not to be as anticipated, estimated or intended. There can be no assurance that such statements will prove to be accurate, as actual results and future events could differ materially from those anticipated in such statements. Accordingly, readers should not place undue reliance on forward-looking statements. Please refer to Endeavour's most recent Annual Information Form filed under its profile at www.sedar.com for further information respecting the risks affecting Endeavour and its business.
APPENDIX: LAFIGUÉ DFS LIFE OF MINE AT $1,500/OZ
| Item | Unit | LOM Total / Average | Pre-Prod | Y-1 | Y-2 | Y-3 | Y-4 | Y-5 | Y-6 | Y-7 | Y-8 | Y-9 | Y-10 | Y-11 | Y-12 | Y-13 | Y-14 | Y-15 | Y-16 |
| Mining Schedule | |||||||||||||||||||
| Total Material Moved | kt | 491,615 | 14,972 | 45,600 | 54,930 | 55,004 | 55,146 | 55,396 | 52,520 | 46,712 | 43,506 | 32,720 | 19,923 | 9,075 | 6,082 | 28 | - | - | - |
| Total Waste Moved | kt | 441,802 | 13,092 | 41,875 | 50,166 | 51,001 | 50,810 | 52,024 | 48,125 | 41,868 | 38,615 | 29,226 | 16,176 | 5,394 | 3,424 | 7 | - | - | - |
| Total Ore Mined | kt | 49,813 | 1,880 | 3,725 | 4,764 | 4,003 | 4,335 | 3,372 | 4,396 | 4,844 | 4,892 | 3,493 | 3,747 | 3,682 | 2,658 | 21 | - | - | - |
| Stripping Ratio | w:o | 8.9 | 7.0 | 11.2 | 10.5 | 12.7 | 11.7 | 15.4 | 10.9 | 8.6 | 7.9 | 8.4 | 4.3 | 1.5 | 1.3 | 0.3 | - | - | - |
| Au Grade - Ore Mined | g/t | 1.69 | 1.46 | 1.46 | 1.44 | 1.47 | 1.92 | 1.96 | 1.72 | 1.54 | 1.57 | 2.10 | 1.89 | 1.86 | 1.71 | 1.96 | - | - | - |
| Contained Gold - Ore Mined | koz | 2,714 | 88 | 175 | 220 | 189 | 267 | 213 | 243 | 239 | 247 | 236 | 228 | 220 | 146 | 1 | - | - | - |
| Processing Schedule | |||||||||||||||||||
| Total Ore Processed | kt | 49,813 | - | 3,266 | 4,000 | 4,098 | 4,011 | 4,016 | 4,006 | 4,000 | 4,003 | 4,008 | 4,000 | 4,000 | 3,851 | 2,554 | - | - | - |
| Au Grade - Ore Processed | g/t | 1.69 | - | 2.01 | 1.64 | 1.52 | 2.05 | 1.75 | 1.85 | 1.76 | 1.80 | 1.91 | 1.81 | 1.75 | 1.32 | 0.44 | - | - | - |
| Contained Gold - Ore Processed | koz | 2,714 | - | 211 | 211 | 200 | 264 | 226 | 238 | 226 | 232 | 247 | 233 | 226 | 163 | 36 | - | - | - |
| Au Recovery | % | 95% | - | 95% | 95% | 95% | 95% | 95% | 95% | 95% | 95% | 95% | 95% | 95% | 95% | 94% | - | - | - |
| Recovered Gold | koz | 2,584 | - | 201 | 201 | 190 | 251 | 216 | 227 | 215 | 221 | 235 | 222 | 215 | 155 | 34 | - | - | - |
| Operating Unit Cost Summary | |||||||||||||||||||
| Mining & Rehandling | $/t Mined | 2.57 | - | 2.33 | 2.35 | 2.40 | 2.56 | 2.59 | 2.70 | 2.90 | 2.83 | 2.89 | 3.02 | 3.67 | 3.71 | 3.18 | - | - | - |
| Processing | $/t Ore Processed | 11.59 | - | 11.08 | 11.29 | 11.62 | 11.67 | 11.66 | 11.66 | 11.66 | 11.66 | 11.66 | 11.66 | 11.65 | 11.65 | 11.66 | - | - | - |
| General & Administrative | $/t Ore Processed | 4.72 | - | 4.77 | 4.68 | 4.56 | 4.66 | 4.66 | 4.67 | 4.68 | 4.67 | 4.67 | 4.68 | 4.68 | 4.86 | 5.49 | - | - | - |
| Total Cash Costs | $/oz Gold Sold | 721 | - | 643 | 768 | 936 | 662 | 601 | 768 | 920 | 695 | 672 | 681 | 554 | 643 | 1,522 | - | - | - |
| All-In-Sustaining Costs | $/oz Gold Sold | 871 | - | 887 | 962 | 1,134 | 850 | 948 | 1,001 | 1,006 | 904 | 734 | 700 | 557 | 648 | 1,522 | - | - | - |
| Environmental Data | |||||||||||||||||||
| GHG Emissions Intensity1 | t CO2e/oz | 0.65 | - | 0.85 | 0.56 | 0.72 | 0.57 | 0.56 | 0.58 | 0.63 | 0.61 | 0.53 | 0.51 | 0.42 | 0.40 | 2.36 | - | - | - |
| Energy Intensity | GJ/oz | 8.00 | - | 10.57 | 6.98 | 9.03 | 7.18 | 7.10 | 7.35 | 7.97 | 7.75 | 6.65 | 6.30 | 5.05 | 4.55 | 18.42 | - | - | - |
| Operating Cash Flow Summary | |||||||||||||||||||
| Gold Revenue (A) | $M | 3,875 | - | 302 | 302 | 285 | 377 | 323 | 340 | 322 | 331 | 353 | 333 | 322 | 233 | 51 | - | - | - |
| Mining & Rehandling | $M | (1,263) | - | (106) | (129) | (132) | (141) | (144) | (142) | (135) | (123) | (94) | (60) | (33) | (23) | (0) | - | - | - |
| Processing | $M | (577) | - | (36) | (45) | (48) | (47) | (47) | (47) | (47) | (47) | (47) | (47) | (47) | (45) | (30) | - | - | - |
| General & Administrative | $M | (235) | - | (16) | (19) | (19) | (19) | (19) | (19) | (19) | (19) | (19) | (19) | (19) | (19) | (14) | - | - | - |
| Inventory Adjustments and Other (incl. Royalties) | $M | 212 | - | 29 | 38 | 20 | 40 | 80 | 33 | 3 | 35 | 2 | (26) | (20) | (14) | (8) | - | - | - |
| Subtotal: Total Cash Cost (B) | $M | (1,863) | - | (129) | (154) | (178) | (166) | (130) | (174) | (198) | (153) | (158) | (151) | (119) | (100) | (52) | - | - | - |
| Sustaining Capital | $M | (386) | - | (49) | (39) | (38) | (47) | (75) | (53) | (19) | (46) | (15) | (4) | (1) | (1) | - | - | - | - |
| Subtotal: All-In-Sustaining Costs (C) | $M | (2,249) | - | (179) | (194) | (216) | (214) | (205) | (227) | (216) | (200) | (173) | (155) | (120) | (101) | (52) | - | - | - |
| Sustaining Margin (A-C) | $M | 1,625 | - | 123 | 108 | 70 | 163 | 119 | 113 | 106 | 131 | 180 | 178 | 202 | 132 | (1) | - | - | - |
| Working Capital Movement | $M | 0 | (39) | 33 | (13) | 10 | 7 | 3 | (3) | (7) | (7) | 8 | 6 | 4 | (1) | 0 | - | - | (2) |
| Taxes | $M | (287) | - | - | - | (20) | (3) | (18) | (32) | (27) | (13) | (28) | (36) | (30) | (43) | (38) | - | - | - |
| FCF Before Non-Sustaining Capital | $M | 1,338 | (39) | 156 | 95 | 59 | 168 | 104 | 78 | 72 | 112 | 160 | 147 | 176 | 88 | (39) | - | - | (2) |
| Non-Sustaining Capital | $M | (126) | - | (6) | - | (11) | (26) | (31) | (0) | (0) | (8) | (22) | (0) | (0) | (0) | (4) | (7) | (7) | (3) |
| Growth Capital | $M | (409) | (409) | - | - | - | - | - | - | - | - | - | - | - | - | - | - | - | - |
| Mine Free Cash Flow | $M | 803 | (448) | 150 | 95 | 49 | 142 | 73 | 78 | 72 | 105 | 138 | 147 | 176 | 88 | (43) | (7) | (7) | (5) |
1 GHG Emissions Intensity calculated as Scope 1 and 2 emissions
Attachment

![]()
