


 Digital signature cloud company DocuSign (NASDAQ: DOCU) stock has fallen (-60%) and lost its CEO in this year’s bear market. The enterprise e-signature business took an unexpected jolt higher during the pandemic lockdowns as the work-from-anywhere, elastic office, and hybrid workforce trend took shape. The pandemic boosted DocuSign stock from obscurity in the $30s to a high of $314.76 before cratering back down to earth in the $60s. Investors are begging the question, “how low can this stock go?” A reversion was expected for all pandemic stocks as economies normalize, but shares have fallen over (-80%) off its 2021 highs. This seems a bit extreme, but we are also experiencing a bear market that is punishing stocks with slowing growth and lack of profits.
 The digitization, data management, and digital transformation tailwinds will continue to drive this stock. Make no mistake, the Company is still profitable and growing, just growing slower. While its core e-signature business is slowing down, the artificial intelligence (AI) powered Contract Lifecycle Management (CLM) Agreement Cloud platform is taking shape to be the next driver of growth. This entails not just e-signatures but all the processes before and afterwards including negotiations, agreements, amendments, renewals, and record tracking. DocuSign has 1.24 million customers and over a billion users worldwide. The Company grew its $300,000 average contract value clients to 886 in the quarter, up from 599 in Q4 2021. Its net retention ratio is 114%. At these levels, there is much speculation about being acquired by a larger player. CEO Dan Springer abruptly and unexpected announced his departure on June 21, 2022, leading some investors to hypothesize that the Company may be up for bids. Prudent investors can watch for opportunistic pullback levels.
Fiscal Q1 2023 Earnings Release
On June 9, 2022, DocuSign released its fiscal first-quarter 2023 results for the quarter ended April 2022. The Company reported earnings-per-share (EPS) profit of $0.38 versus $0.46 consensus analyst estimates, a (-$0.08) miss. Revenues grew 25.5% year-over-year (YoY) to $588.69 million, beating analyst estimates for $581.85 million. Billing rose 16% YoY to $613.6 million beating the range of $573 million to $583 million. Non-GAAP operating margin declines to 17% versus 20% previous year but still within the 16% to 18% previous guidance range. The Company ended the quarter with $1.06 billion in cash and cash equivalents and $750 million in long-term debt. DocuSign CEO Dan Springer commented, "We delivered solid first-quarter results, growing revenue by 25% year-over-year and adding nearly 67,000 new customers, bringing our total global customer base to 1.24 million. We also bolstered our leadership team with key new hires who, together with our existing team, are ensuring we're well-positioned to grow and scale our business. With over a billion users worldwide, the proven value of our products, and the significant opportunity we have ahead of us, we're confident in our ability to successfully navigate the challenges of a dynamic global environment."
In-Line and Lowered Guidance
DocuSign provided in-line fiscal Q2 2023 guidance for revenues to come in between $600 million to $604 million versus $603.54 million consensus analyst estimates. Q2 billings are expected between $599 million to $609 million with a non-GAAP operating margin between 16% to 18%. Fiscal full-year revenues are expected between $2.470 billion to $2.482 billion versus $2.48 billion consensus estimates. The Company lowered full-year 2023 billings guidance to come in between $2.521 billion to $2.541 billion, down from $2.706 billion to $2.726 billion earlier guidance.
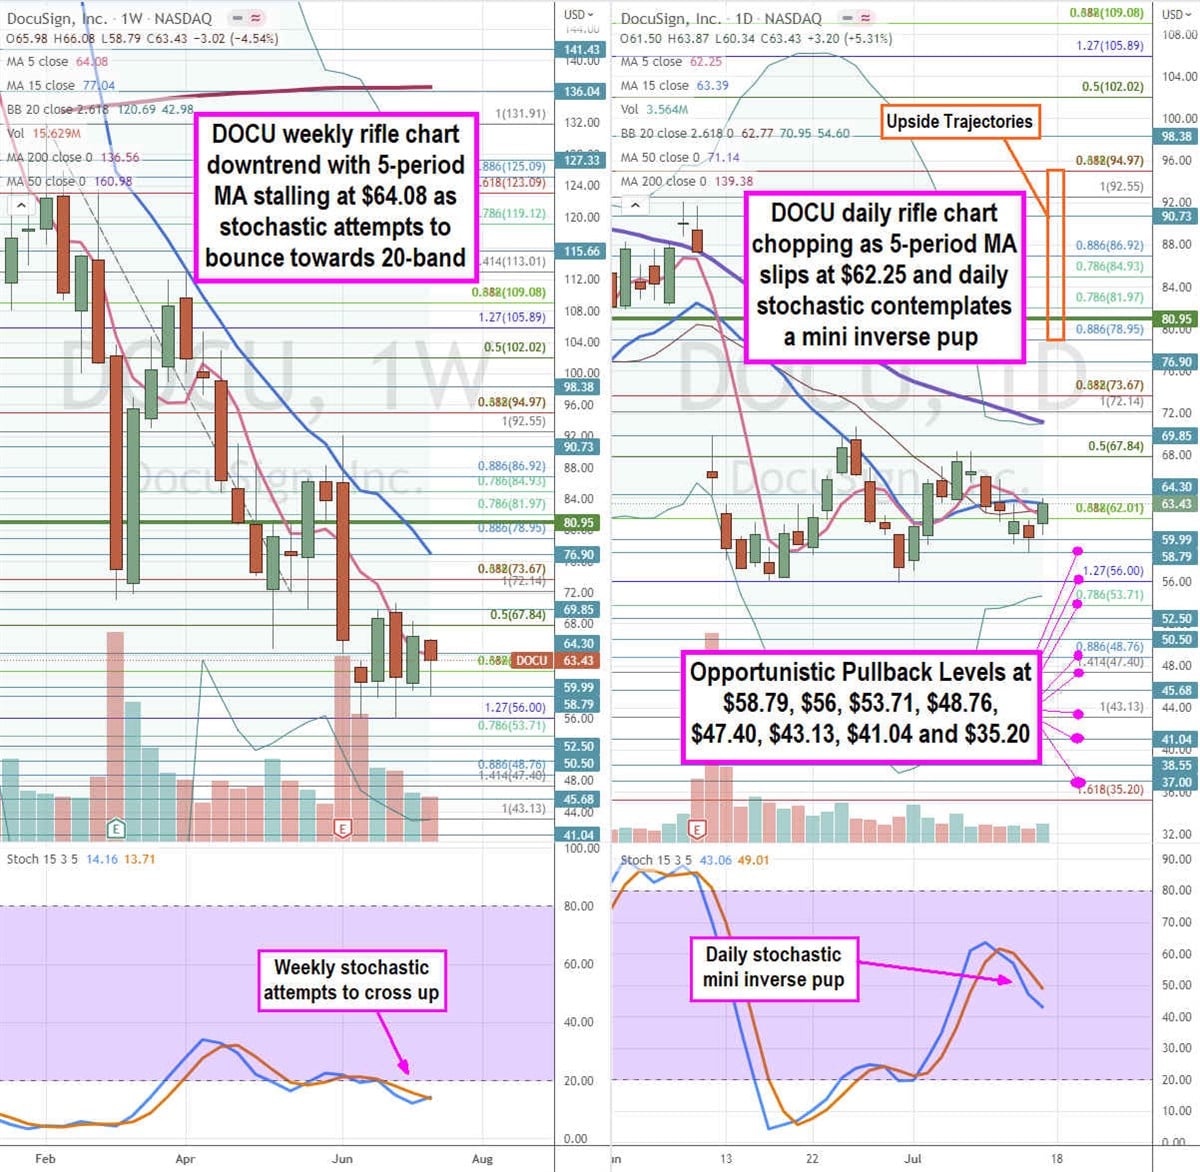
DOCU Opportunistic Pullback Levels
Using the rifle charts on the weekly and daily time frames provides a precision view of the landscape for DOCU stock. The weekly rifle chart made a potential double bottom off the $56 Fibonacci (fib) level. The weekly rifle chart downtrend has a falling 5-period moving average (MA) at $64.08 followed by the lagging 15-period MA at $77.04. The weekly stochastic is attempting to cross back up towards the 20-band. The weekly lower Bollinger Bands (BBs) sit at $42.98. The weekly market structure low (MSL) buy triggers above $80.95 level. The daily rifle chart has been chopping as the breakout attempt failed near the $67.84 fib and attempt a breakdown with a falling 5-period MA at $62.25 and 15-period MA at $63.39. The daily lower BBs sit at $54.60 and upper BBs overlap the 50-period MA at $71.14. The BBs are compressing ahead of a price range expansion. Prudent investors can watch for opportunistic pullback levels at the $58.79, $56 fib, $53.71 fib, $48.76 fib, $47.40 fib, $43.13 fib, $41.04, $37, and $35.20 fib. Upside trajectories range from the $78.95 fib up towards the $94.97 fib level. Investors can also watch competitor Adobe (NASDAQ: ADBE) stock for sympathy price action.
