


Informatica Inc. (INFA) is an Artificial Intelligence (AI)-powered platform developer that connects and manages data across multi-cloud, hybrid systems at enterprise scale. The software company’s platform includes a range of interoperable data management products.
INFA announced a cloud-only, consumption-driven (CoCd) strategy in January, aiming to deliver continued AI-powered product innovation, strong cloud subscription ARR, and higher operating margins.
Although the company expects to incur non-recurring charges in the short term, the cost savings benefit of the strategy is projected to be approximately $84 million on a GAAP basis or approximately $70 million on a non-GAAP basis in fiscal 2024.
On October 31, it approved a new share repurchase authorization enabling the repurchase of up to $200 million of its Class A common stock through privately negotiated purchases with individual holders or in the open market. Moreover, for fiscal 2023, INFA expects its total revenues to be between $1.57 billion and $1.59 billion, representing about 5% year-over-year growth at the midpoint.
Amid such noteworthy steps taken by the company, let’s look at the trends of INFA’s key financial metrics to understand why the stock could be a solid buy now.
Analyzing Informatica's Financial Performance: A Detailed Overview From June 2021 to September 2023
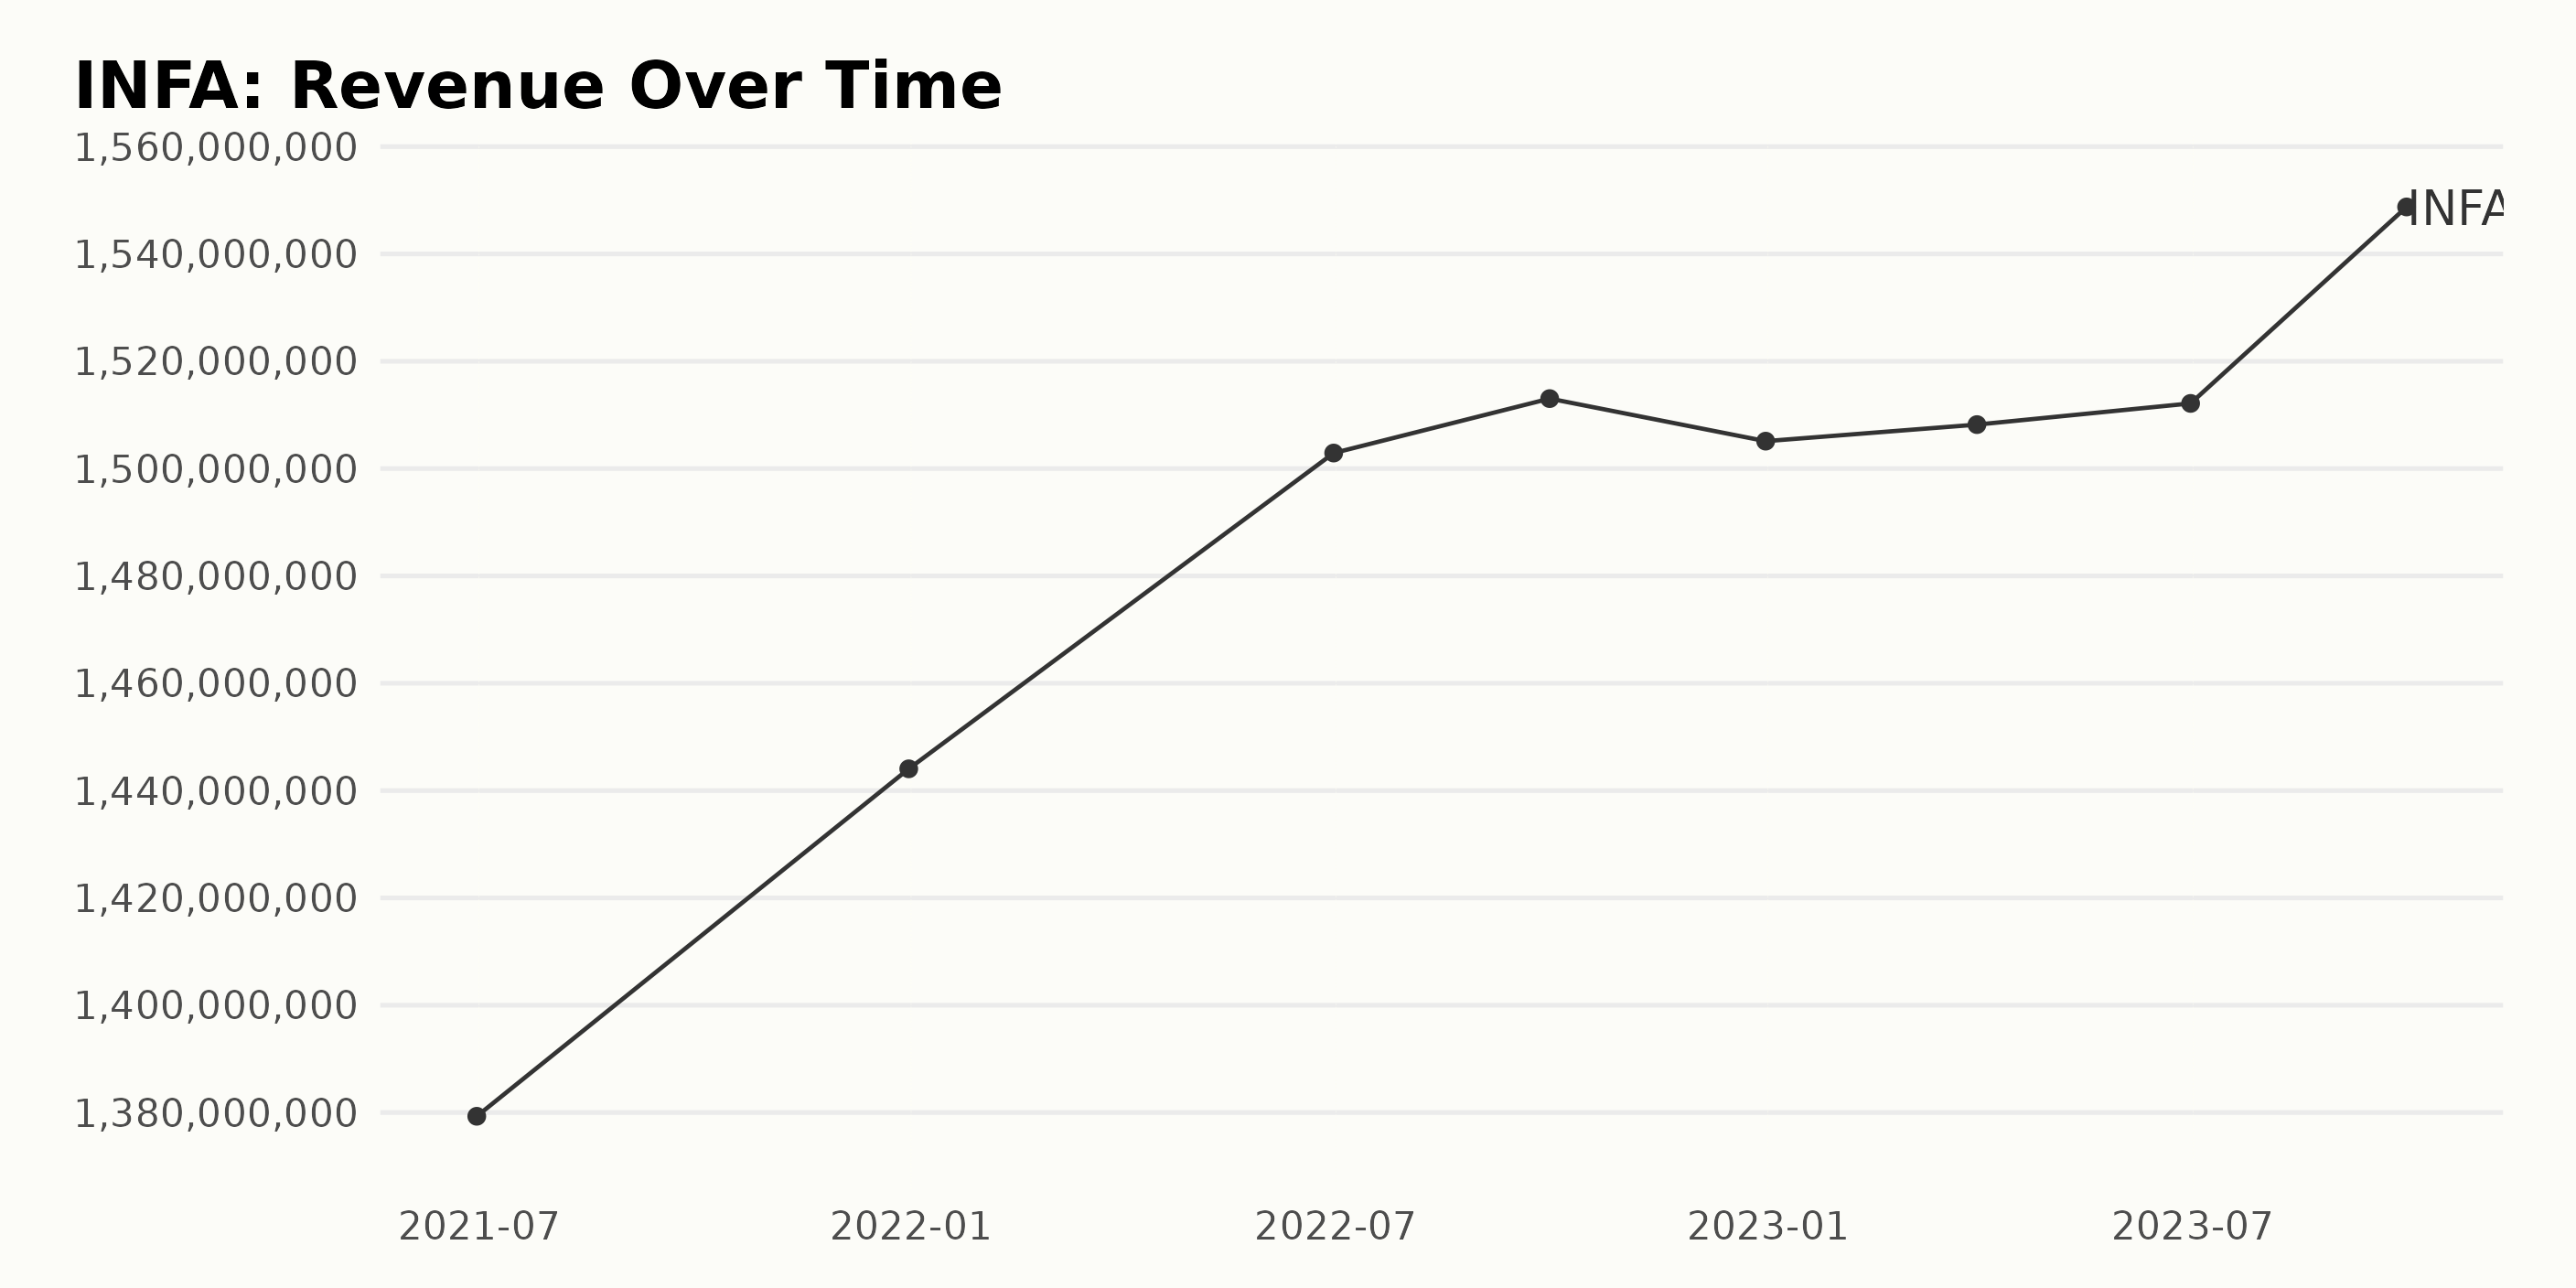
INFA has shown steady trailing-12-month revenue growth over the studied period, with a few notable fluctuations.
- As of June 30, 2021, INFA reported revenue of $1.38 billion.
- Revenue increased marginally to $1.44 billion by December 31, 2021.
- By June 30, 2022, revenue further escalated to $1.50 billion, and a little uptick was seen on September 30, 2022, with the revenue reaching $1.51 billion.
- However, a slight dip was observed by December 31, 2022, as revenue fell back to $1.50 billion.
- This trend was short-lived when, by March 31, 2023, revenue rebounded to $1.51 billion, followed by a consistent increase up to $1.54 billion on June 30, 2023, and reached its highest point so far at $1.55 billion by September 30, 2023.
The latest data, September 30, 2023, shows revenue standing at $1.55 billion, indicating a significant growth compared to the initial $1.38 billion recorded in June 2021.
Therefore, from June 2021 to September 2023, INFA experienced a revenue growth rate of approximately 12%. This suggests that INFA is showing a consistent performance in terms of revenue generation, barring some minor setbacks over the analyzed period. The company's resilience is evident in its ability to bounce back from short-lived drops in revenue.
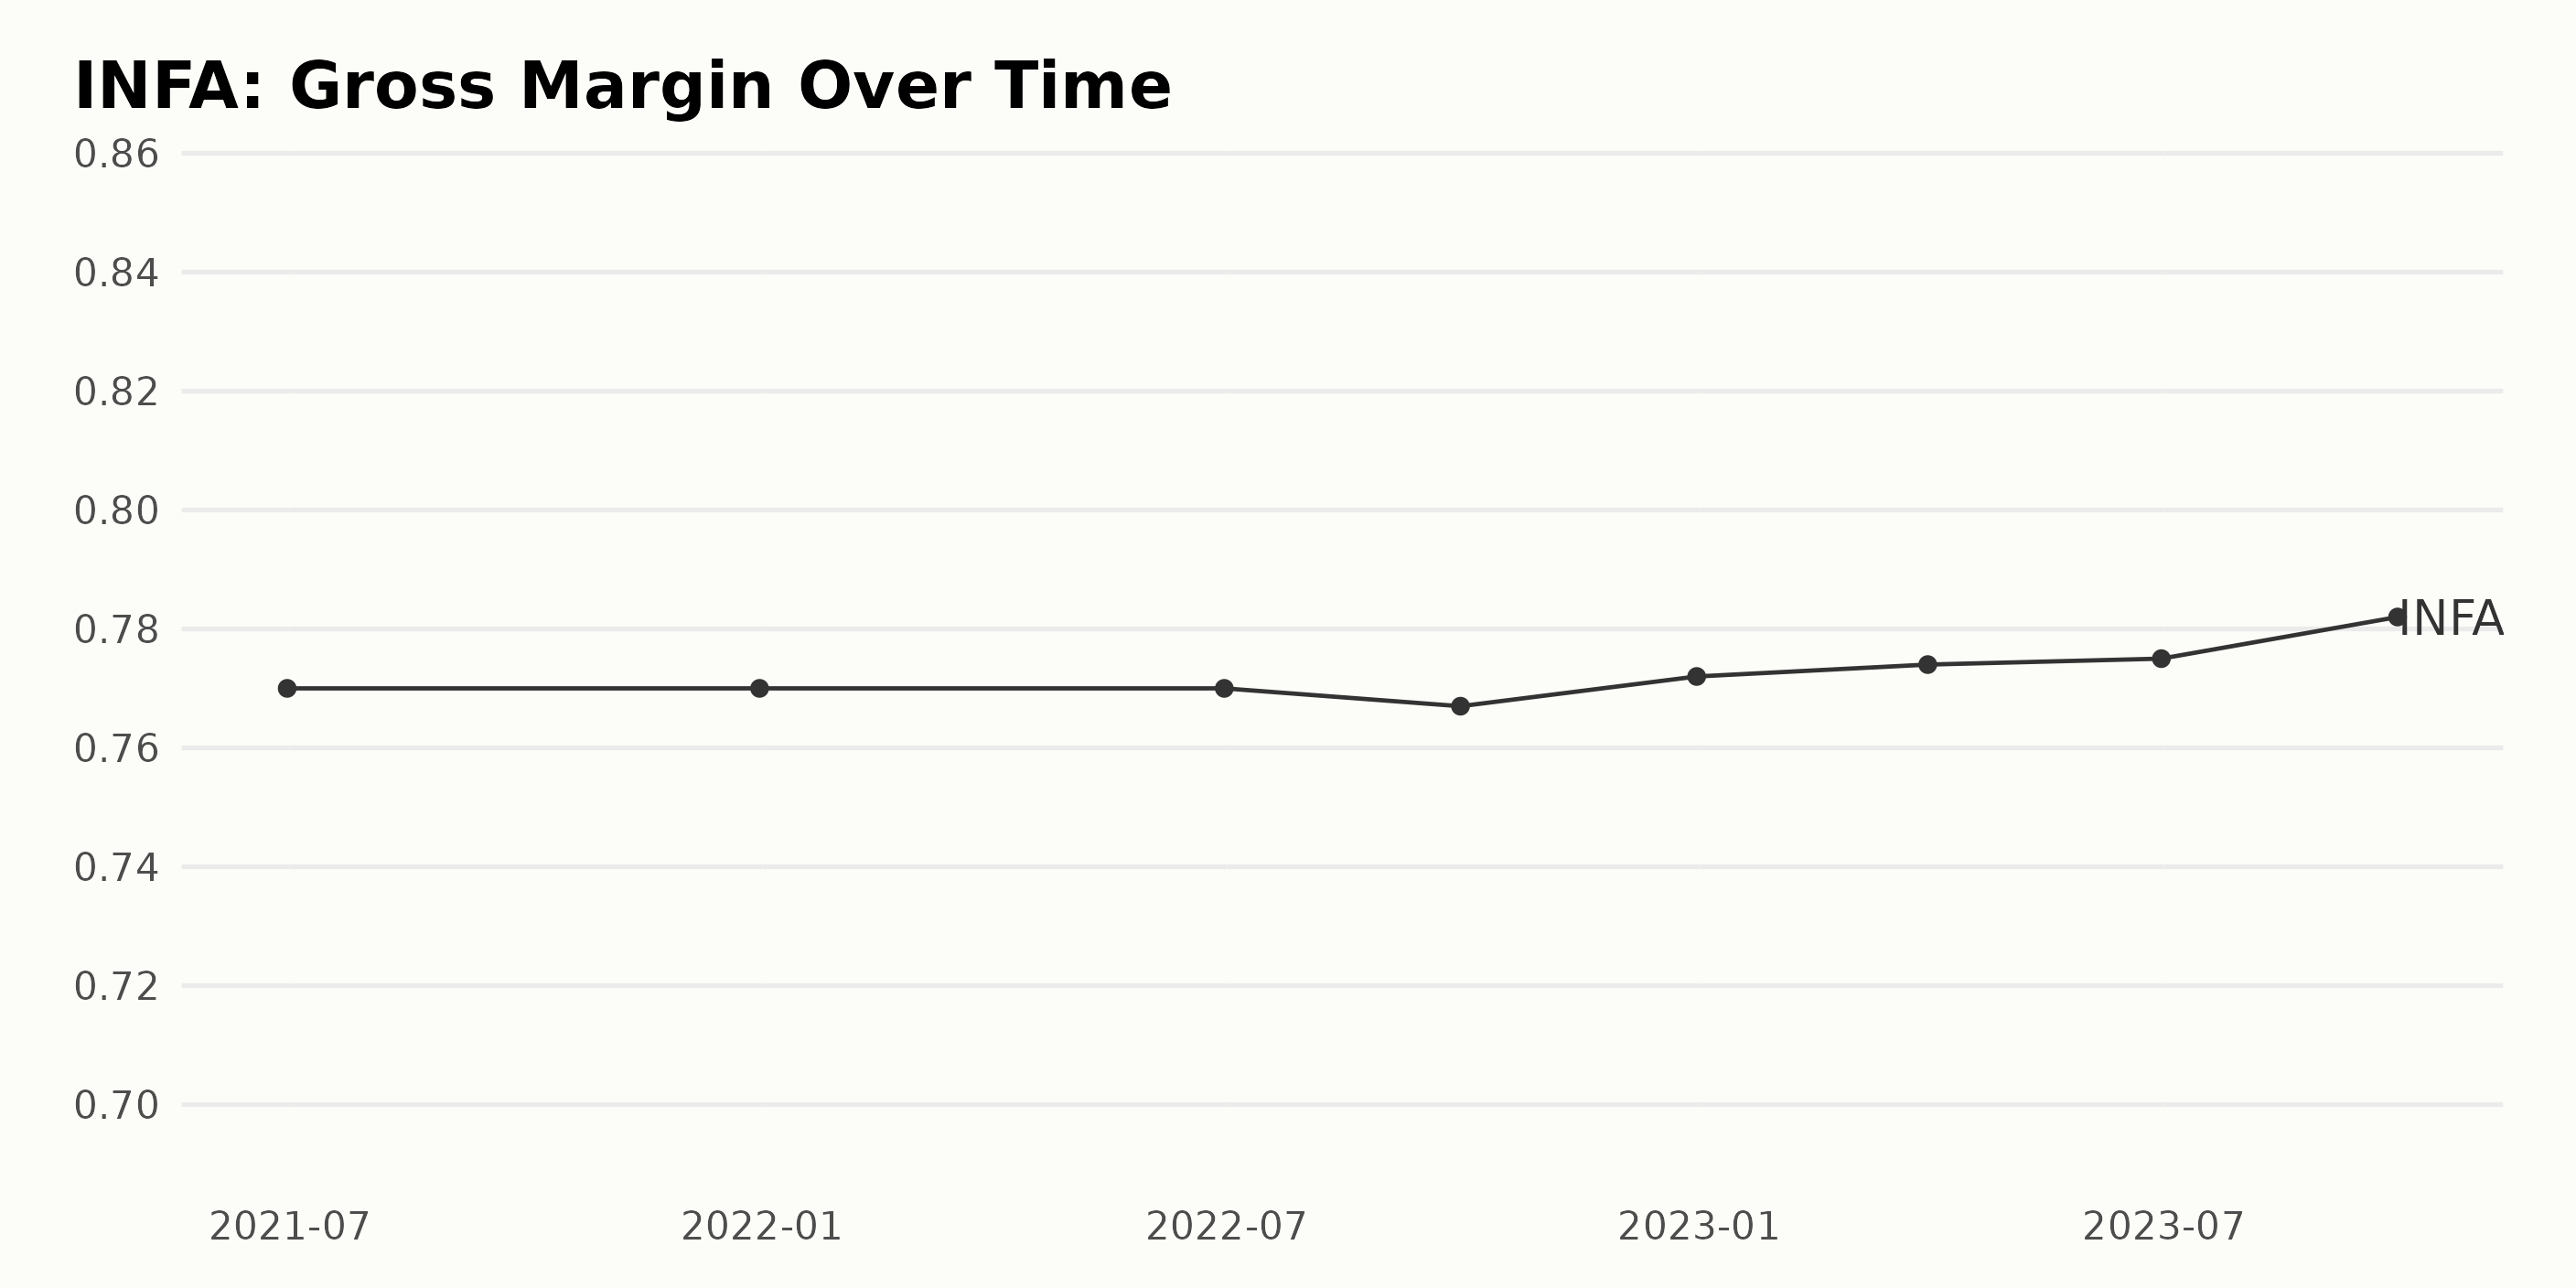
The gross margin performance of INFA has exhibited slight oscillations between June 2021 and September 2023. Each value has been multiplied by 100 and displayed with a percentage sign as follows:
- June 2021: 77.00%
- December 2021: 77.00%
- June 2022: 77.00%
- September 2022: 76.70%
- December 2022: 77.20%
- March 2023: 77.40%
- June 2023: 77.50%
- September 2023: 78.20%
In recent terms, since the meager decline to 76.70% in September 2022, the company's gross margin made a steady recovery and even showed some improvement. In fact, the latest figure, as of September 2023, is slightly over the initial values observed in 2021, standing at 78.20%.
Growth from June 2021 to September 2023, calculated by measuring the last value from the first value, indicates a moderate increase of approximately 1.20%. This data suggests that INFA, albeit with minor fluctuations, has managed to maintain and slightly improve its gross margin over the said period.
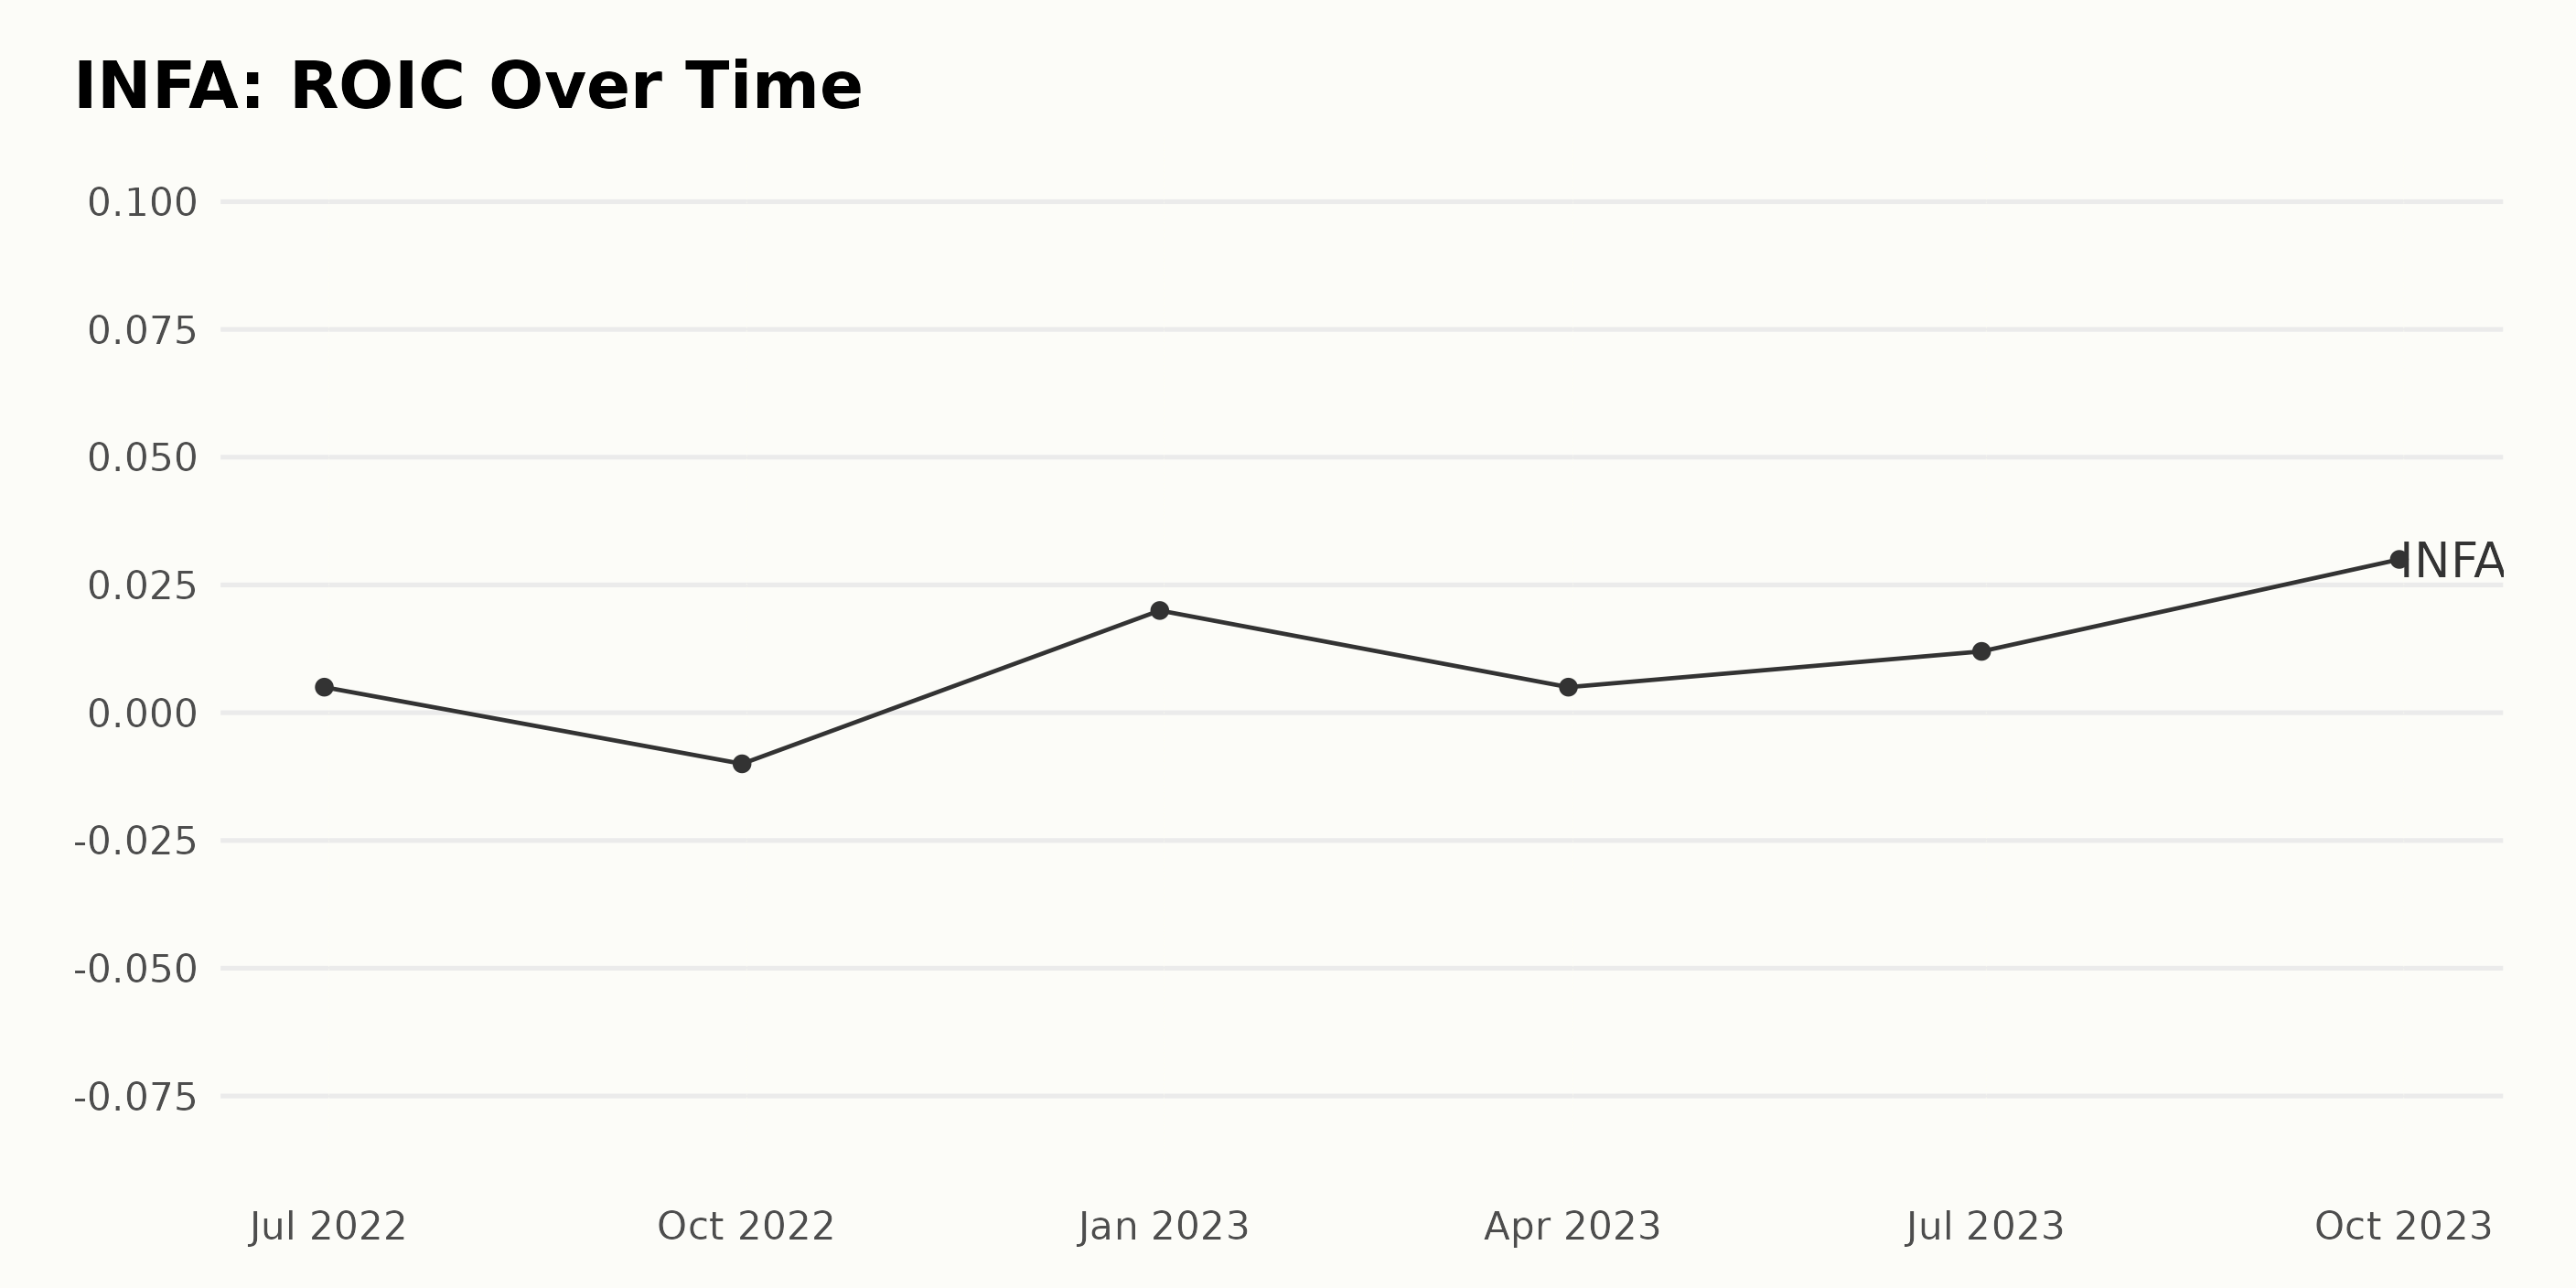
The Return On Invested Capital (ROIC) of INFA has depicted a general upward trend, albeit with several fluctuations from 2022 to 2023. Here's a narrowed-down summary of the trend:
- As of June 30, 2022, the ROIC stood at 0.005 or 0.5%.
- Thereafter, a significant dip was observed by September 30, 2022, as the ROIC plunged to -0.01, marking a negative ROIC.
- However, a sharp rebound was witnessed by December 31, 2022, with the ROIC rising to 0.02 or 2%.
- The value again decreased to 0.005 (0.5%) on March 31, 2023, marking a momentary drop in performance.
- A gradual increase was observed on June 30, 2023, where the ROIC rose to 0.012 or 1.2%.
- The last available data point, as of September 30, 2023, shows an impressive climb to 0.03 or 3%, indicating a positive growth pattern.
Although the regular flip-flop in the metric's value points to a volatile operational efficiency, the calculated growth rate from the first value of 0.005 in June 2022 to the last value of 0.03 in September 2023 shows a substantial growth of 500%.
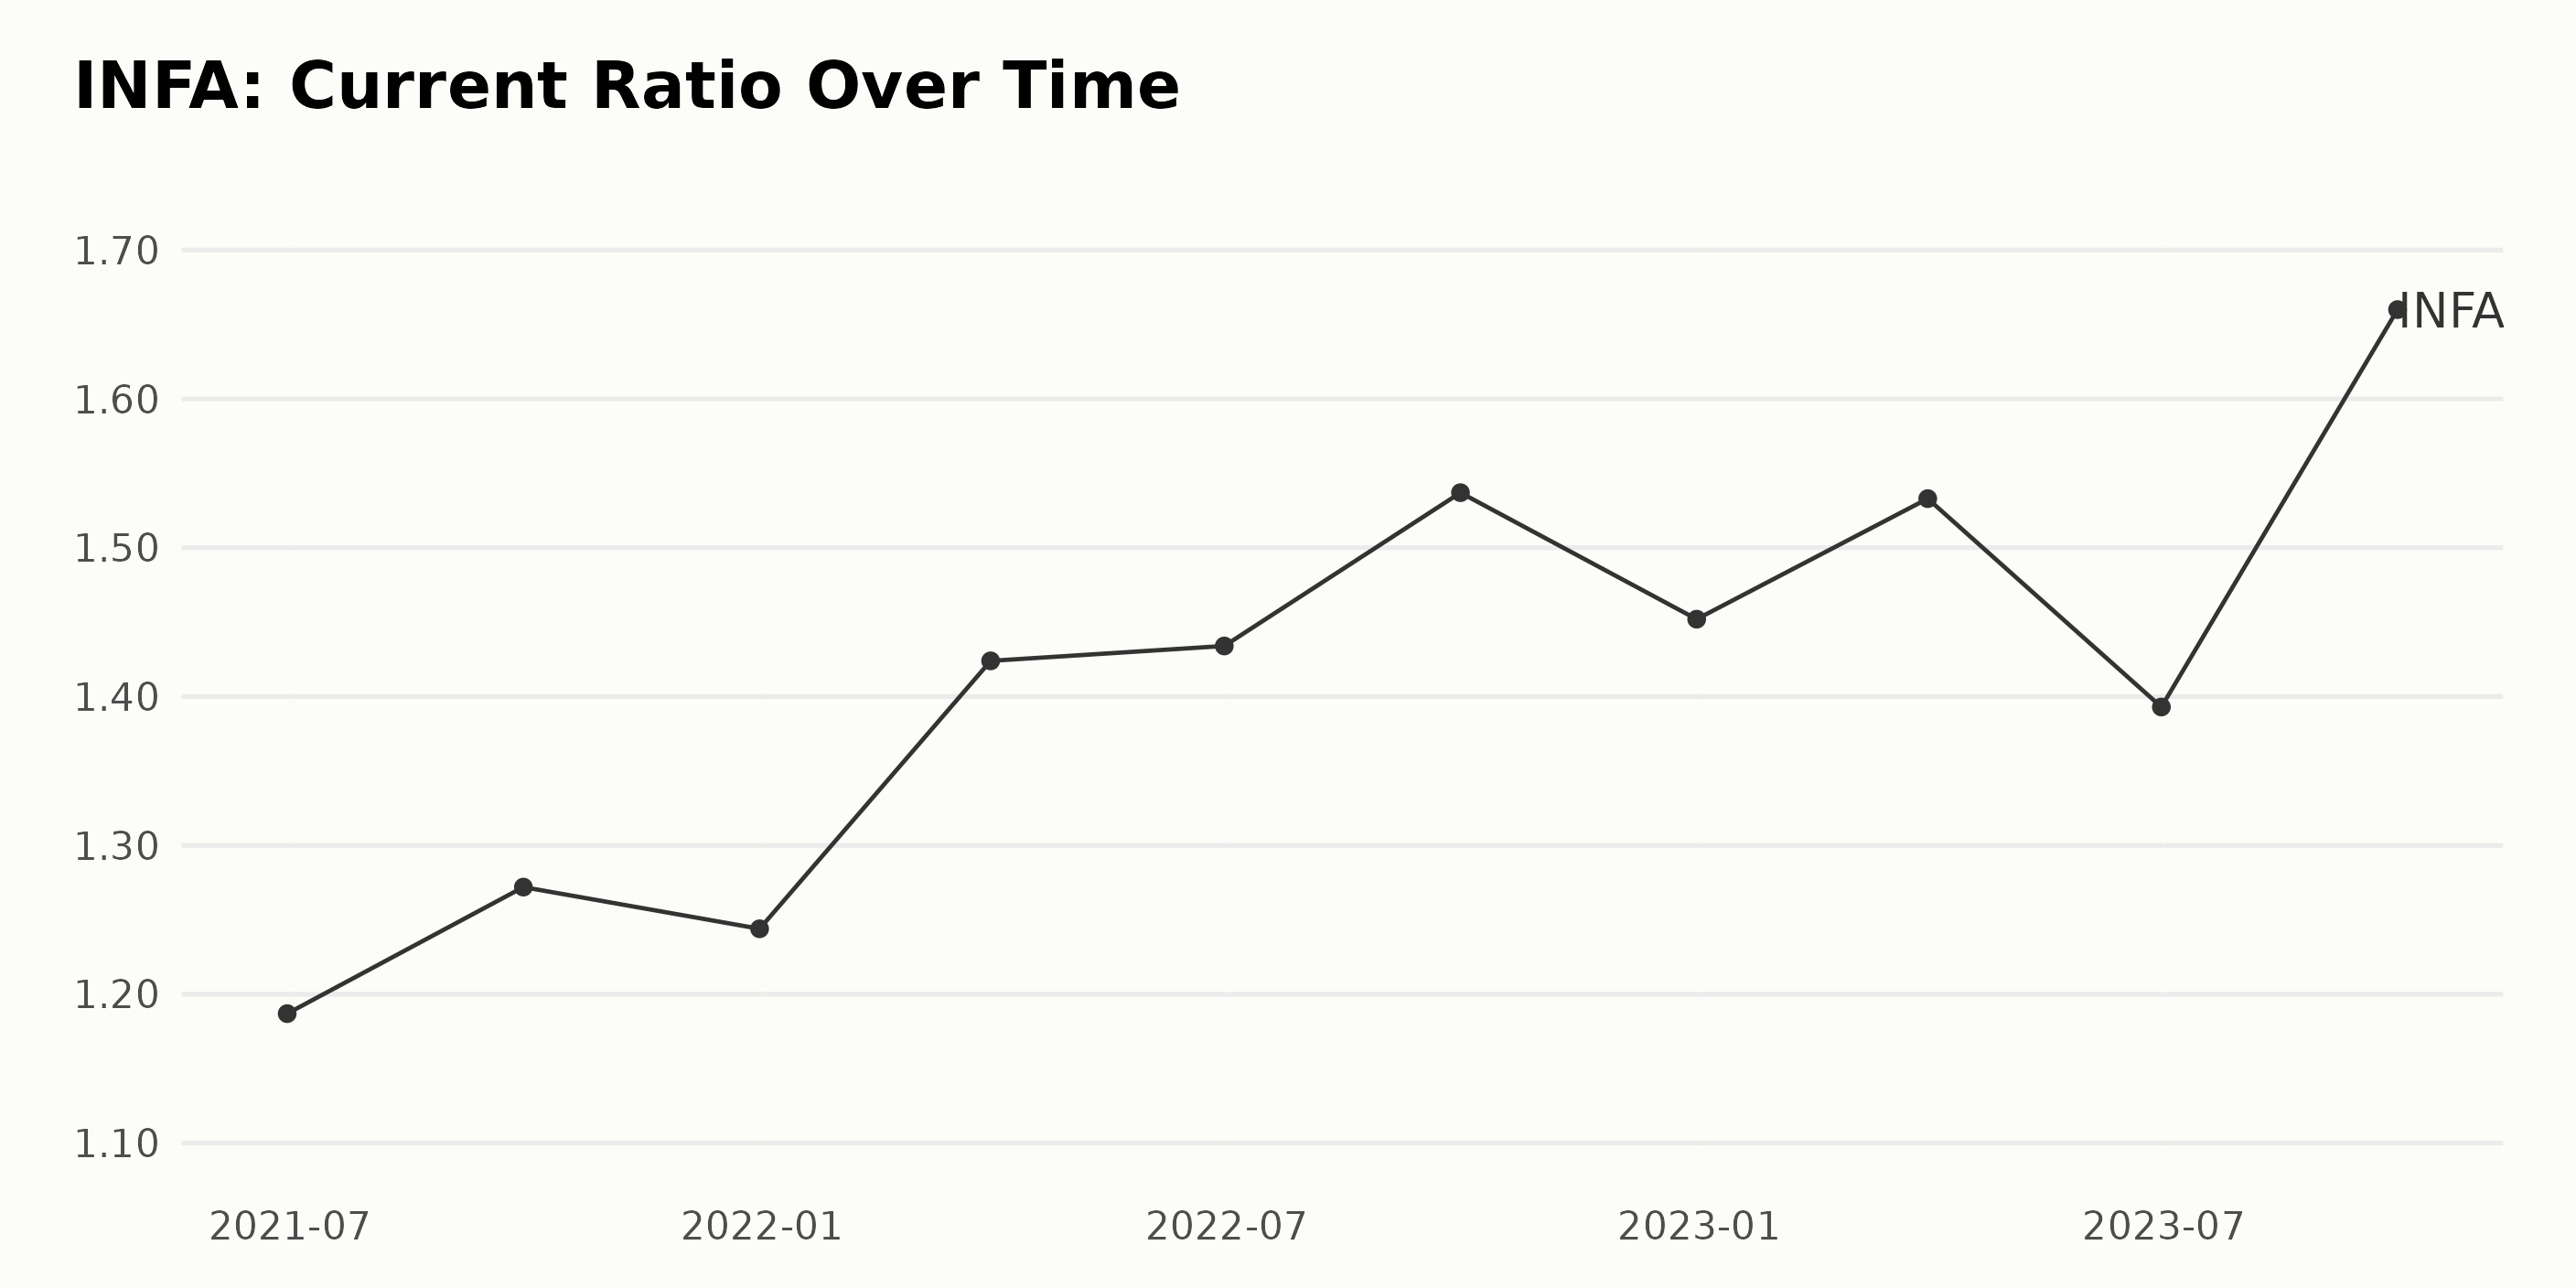
The current ratio of INFA has demonstrated a general upward trend with intermittent fluctuations over the given period. Following are key observations based on the provided data:
- Starting from June 2021, at a current ratio of 1.19, INFA saw an increase to 1.27 in September 2021 - a growth rate of ~7%.
- There was a slight drop recorded at 1.24 in December 2021 before it climbed up again to reach 1.42 in March 2022.
- The value again marginally increased, reaching 1.43 in June 2022 and peaked at 1.54 at the end of September 2022.
- After a small decline to 1.45 by the end of 2022, the ratio again increased to 1.53 at the end of the first quarter in 2023.
- Although it dropped to 1.39 in June 2023, it bounced back and hit a record high at 1.66 at the end of September 2023.
Hence, while the current ratio over this data series shows some oscillation, the overall growth trajectory suggests a constructive financial position for INFA, with a total growth rate of ~40% from June 2021 to September 2023. Despite some fluctuations, more recent quarters indicate a stronger liquidity state for the company over time.
Analyzing Informatica's Share Prices: Marked Growth Despite Fluctuations in H2, 2023
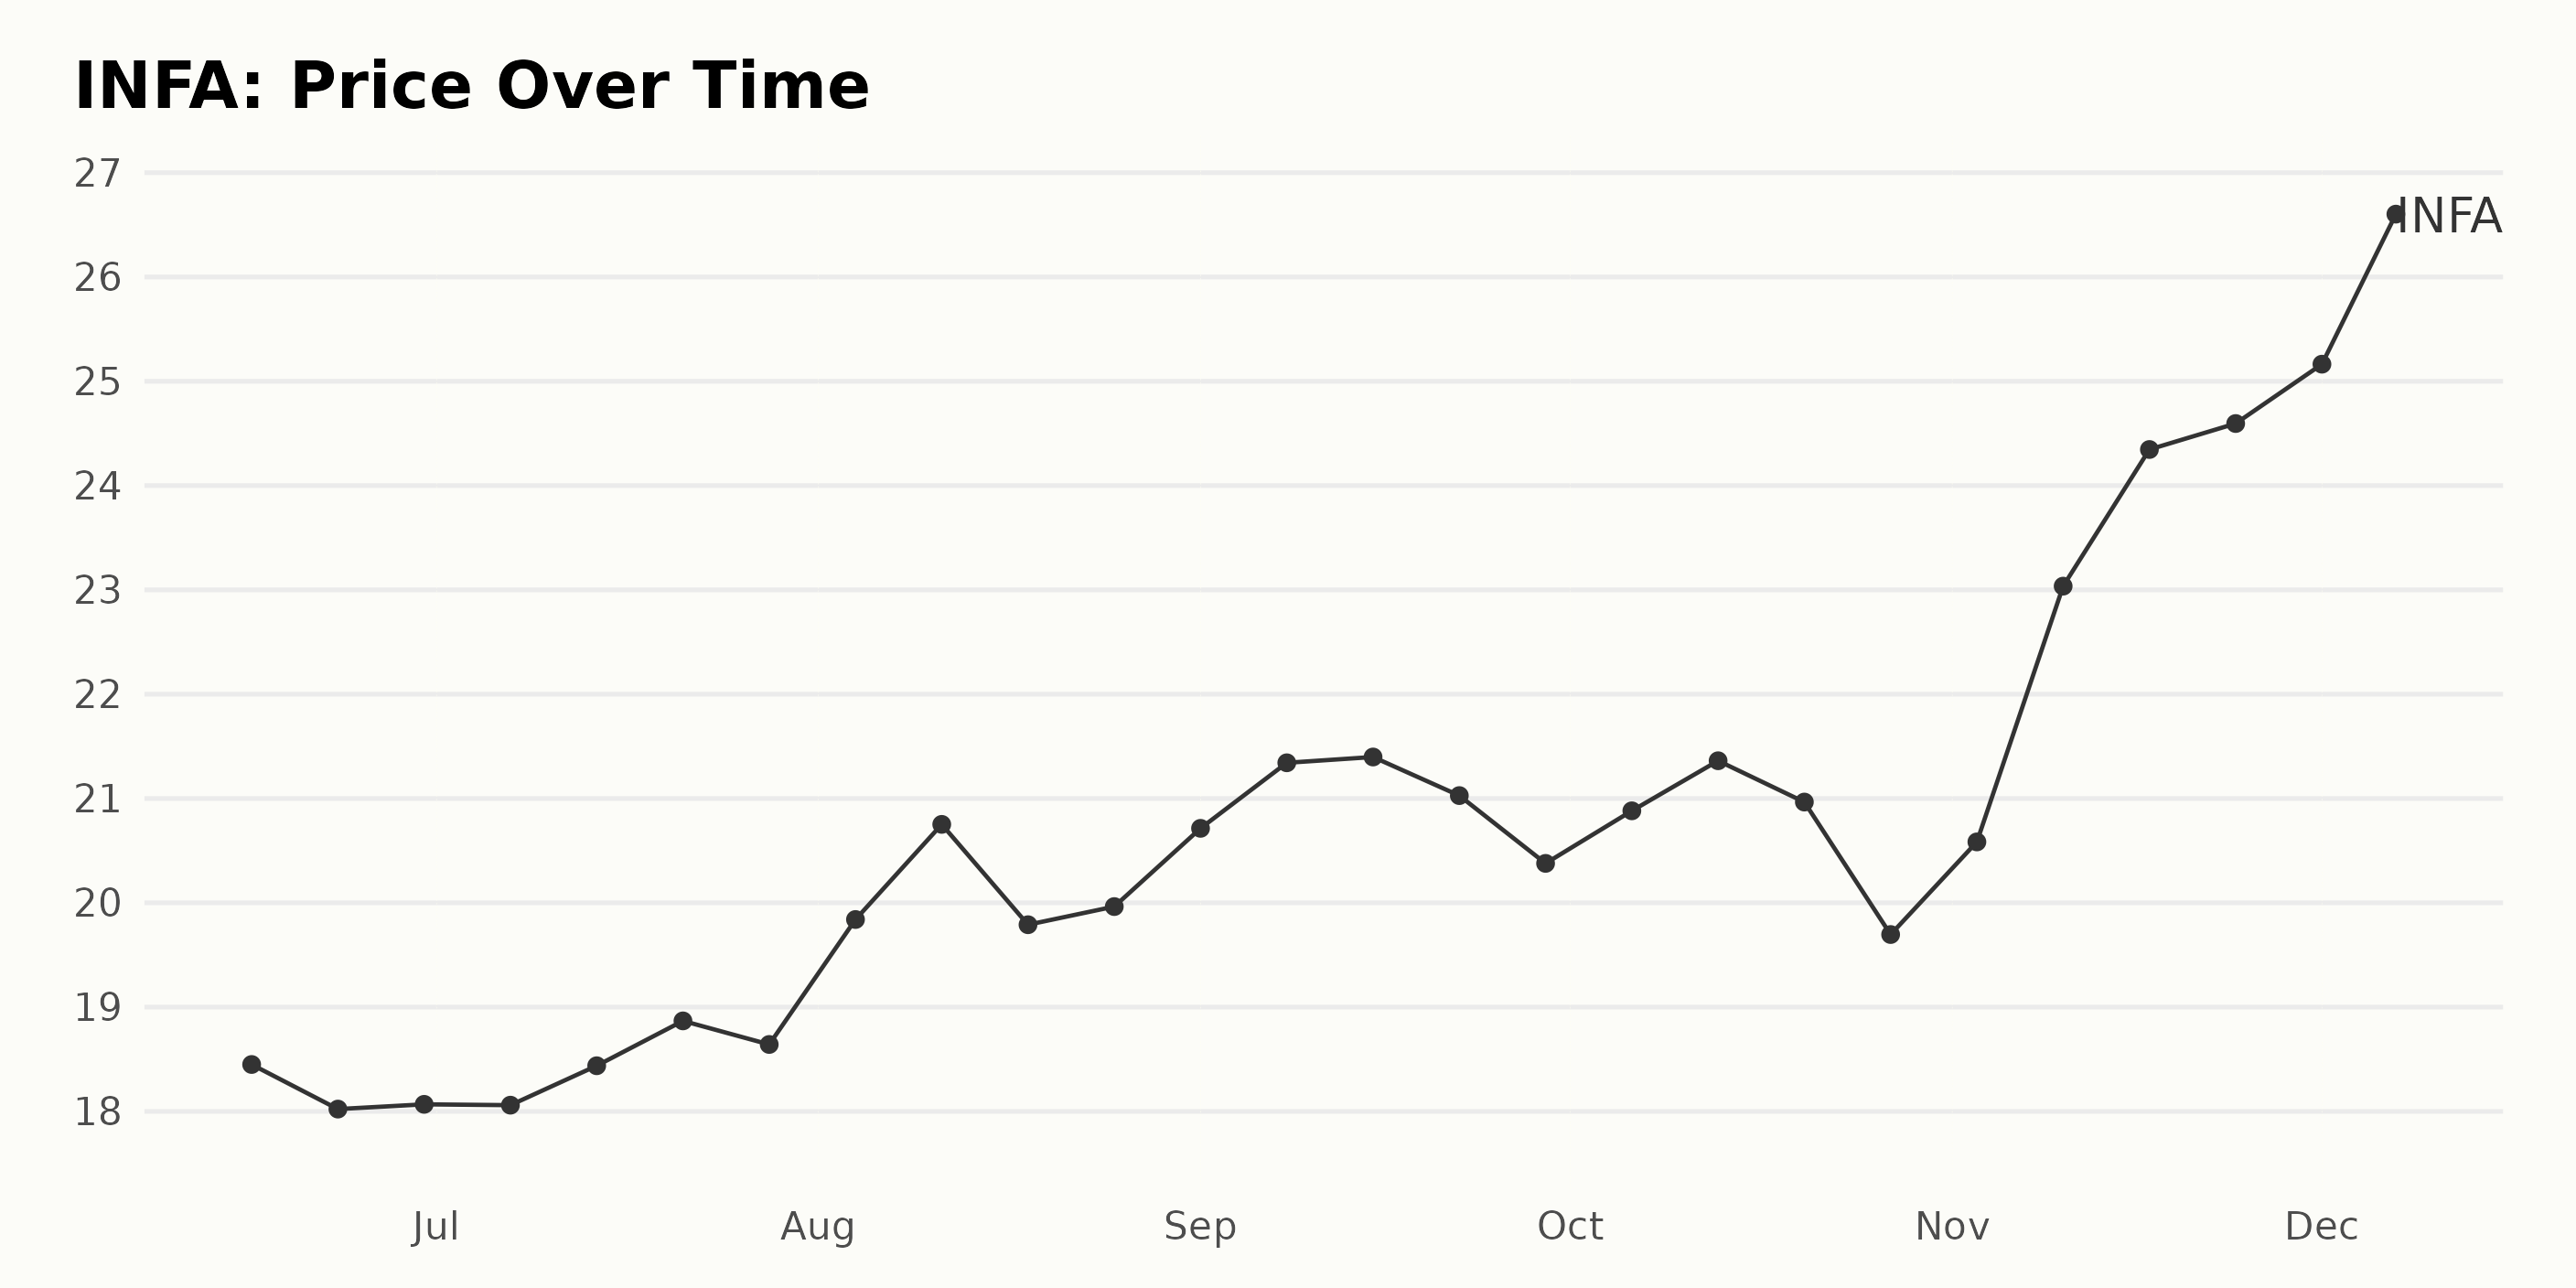
Examining the share prices of INFA from mid-June to early December 2023 shows a general upward trend, with some notable fluctuations throughout this period.
- On June 16, 2023, INFA shares were priced at $18.45.
- The price then experienced a minor decline in late June to reach $18.02 by June 23, 2023.
- In July 2023, the prices fluctuated between $18.06 and the highest point of $18.87 on July 21, 2023.
- August saw a significant increase in prices, hitting a high of $20.75 on August 11, 2023.
- Through September, prices continued to rise steadily, reaching a high of $21.40 on September 15, 2023.
- The share price fluctuated slightly during October, with the price dropping to $19.69 by October 27.
- However, November witnessed a noticeable surge, with the price closing at $24.59 on November 24, 2023.
- Finally, in early December, the stock's price reached $27.09 on December 7, 2023.
Over the course of almost six months, INFA's share prices went through some ups and downs but showed an overall positive growth rate. While the price did see minor decreases occasionally, it's important to note that these were followed by higher peaks, indicating a strong price recovery and underlying growth trend.
However, this growth rate isn't constant, and periods of slower and faster growth can be identified throughout this period. Such varied growth rates may suggest a potential deceleration or acceleration at certain points, depending on the market conditions and other influencing factors during those times. Here is a chart of INFA's price over the past 180 days.
Analyzing 2023’s Positive Rating Trends for Informatica Across Key Dimensions
Looking at the provided data, we can assess INFA's POWR Ratings grade progression throughout the period from June 2023 through December 2023. Here's a summary:
- In the weeks leading up to August, INFA maintained a consistent B (Buy) POWR grade within the 23-stock Software - SAAS category of stocks and a fluctuating rank, ranking third most of the time.
- By August, INFA improved in its category ranking, claiming the top spot for two consecutive weeks (the week of August 19 and the week of August 26). The POWR grade persisted as B (Buy) during this period.
- In September, we observed an upgrade in the POWR grade to A (Strong Buy). Despite the improvement, INFA drifts between ranks #1 and #2 within its category throughout the month.
- The POWR grade dipped back down to B (Buy) for the last week of September and the month of October. However, we can see consistency in its rank, maintaining the second spot within its category for this duration.
- Finally, INFA seems to have recovered its POWR grade A (Strong Buy) from November onwards and holds onto the second rank within its category until the last reported date in early December.
Based on the latest value from the data, INFA possesses a POWR grade of A (Strong Buy), and it ranks second in the 23-stock Software - SAAS category as of December 8, 2023.
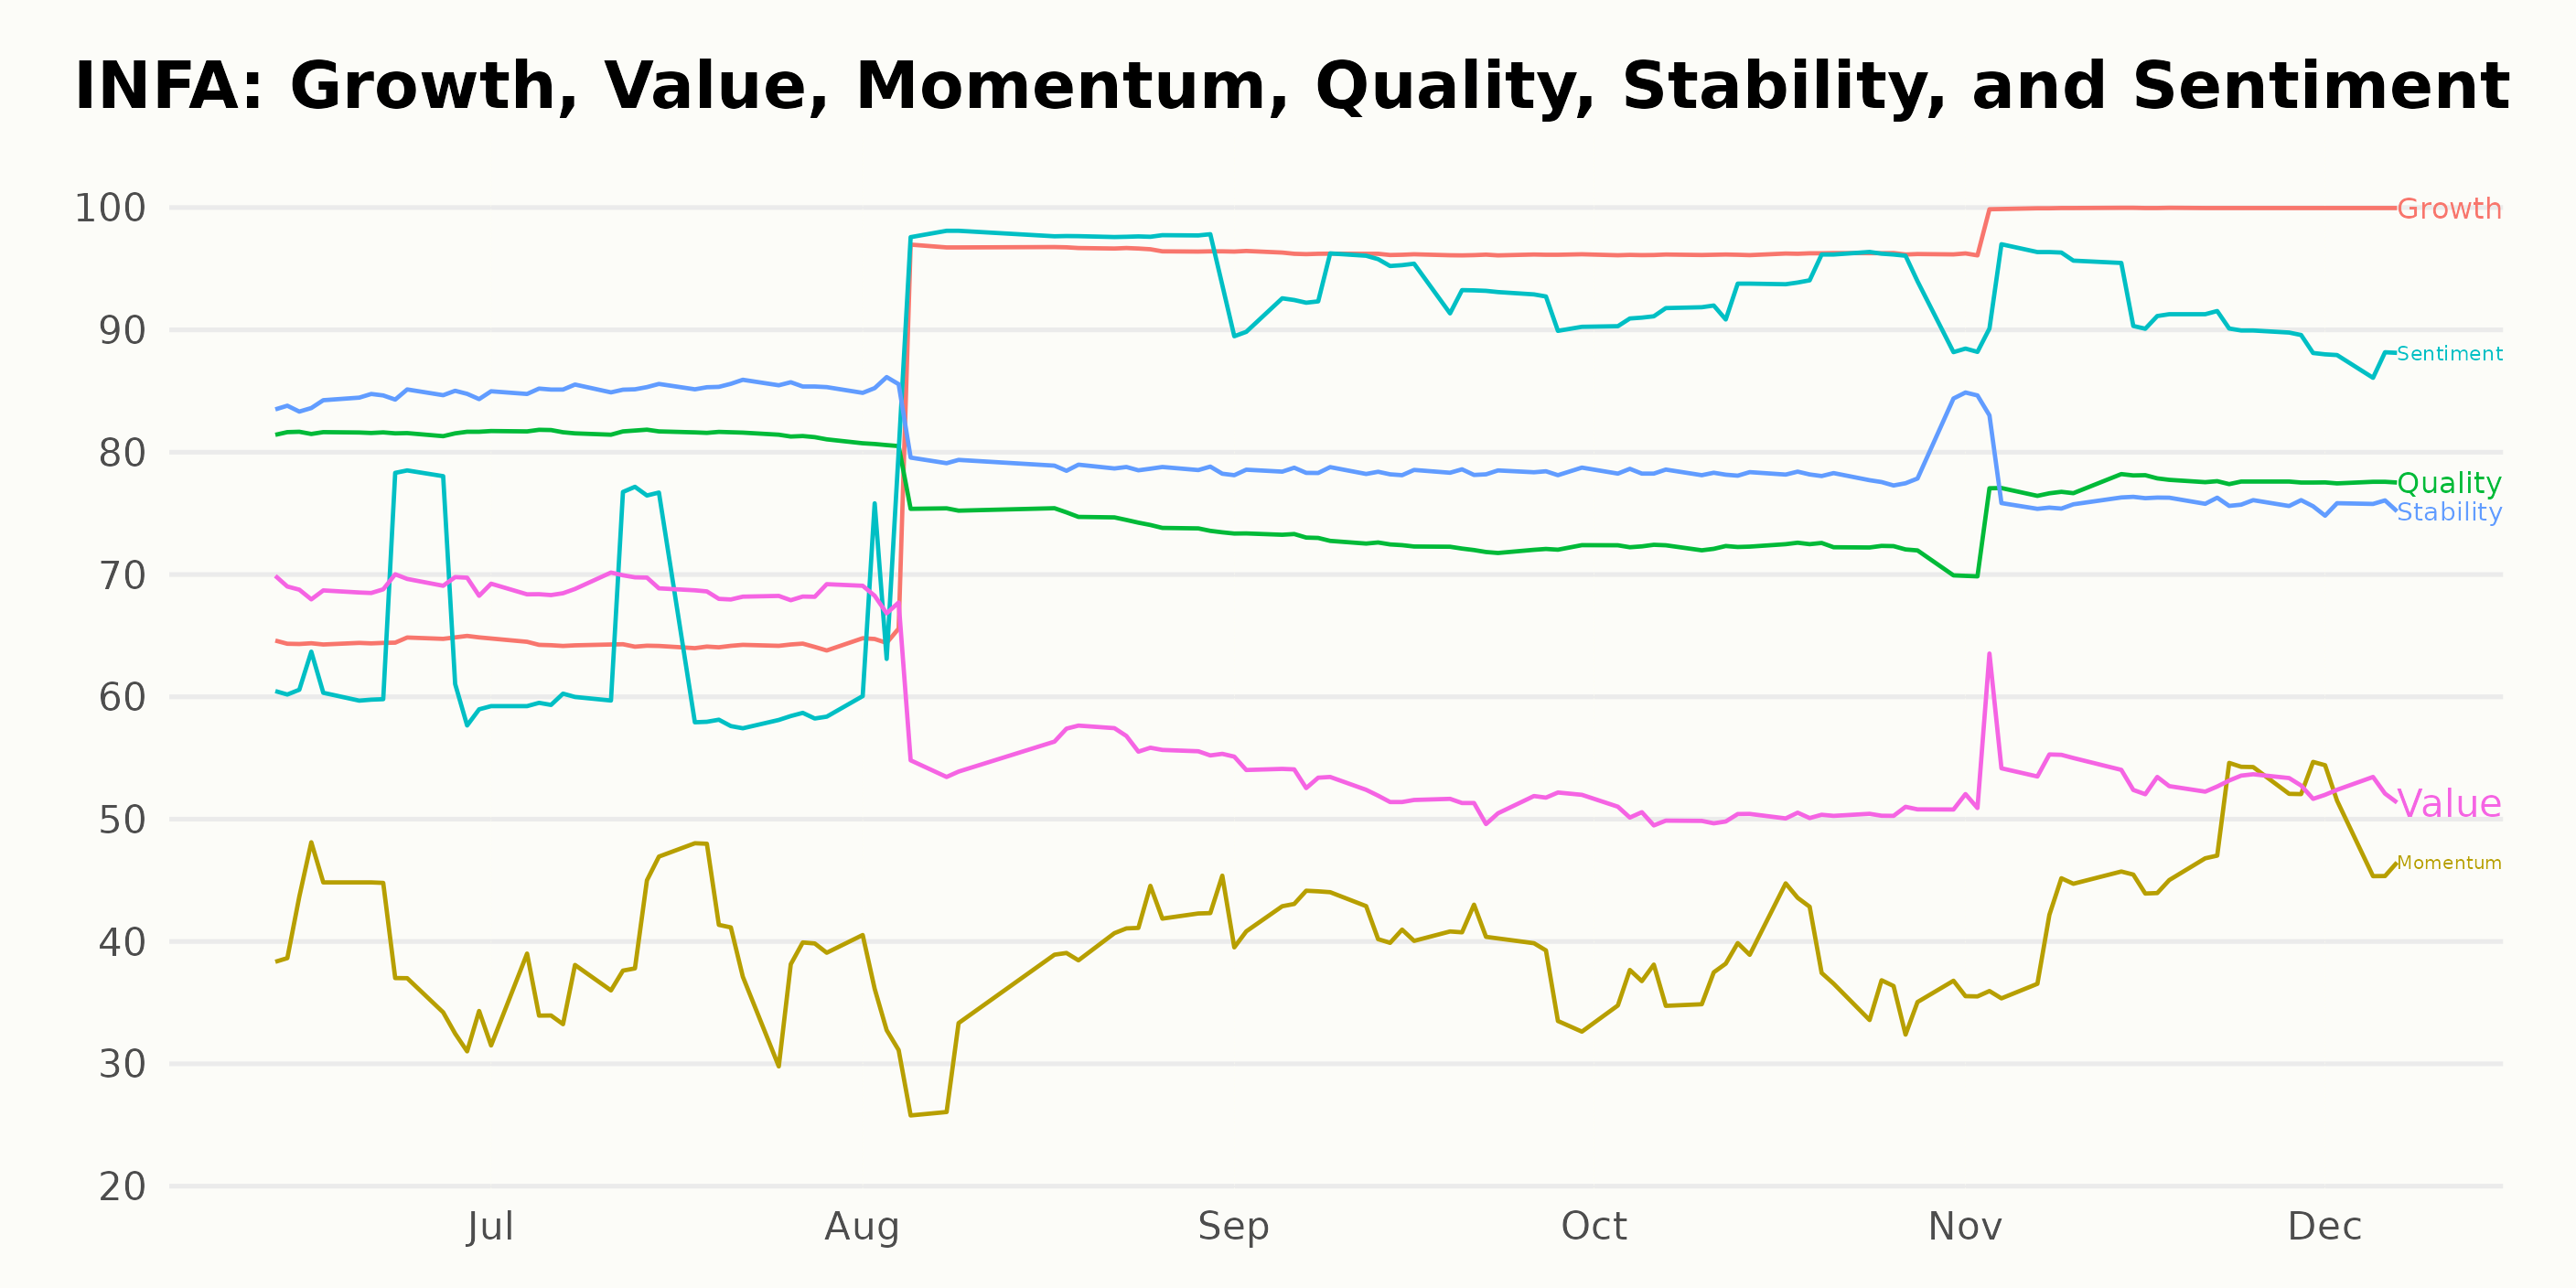
The POWR Ratings for INFA, along several dimensions, present a significant analysis of this prominent corporation. The three most noteworthy dimensions to discuss include growth, sentiment, and momentum.
Growth
- The rating for the Growth dimension increased steadily from 65 in June 2023 to reach a remarkable 100% score by November 2023. This 100% remained unchanged in early December 2023, showing a consistent trend of improvement throughout this period.
Sentiment
- The Sentiment dimension displayed a rising trend from June 2023 (64) through to October 2023 (93). However, there was a slight decline to 88 in the first week of December 2023. Despite this drop, the Sentiment dimension maintained a consistently high rating overall.
Momentum
- The rating for the Momentum dimension was relatively stable but showed a slow upward trend. Starting at 40 in June 2023, it rose gradually to reach 49 by the first week of December 2023. Despite its slower pace compared to other dimensions, the Momentum still posed an evident improvement.
Overall, the successive ratings indicate a positive trend in the named dimensions for INFA's performance. Despite fluctuations, there is an unmistakable progressive trend within the stated period.
How does Informatica Inc. (INFA) Stack Up Against its Peers?
Other stocks in the Software - SAAS sector that may be worth considering are Vimeo, Inc. (VMEO), DocuSign, Inc. (DOCU), and MiX Telematics Limited (MIXT) - they have an overall grade of A (Strong Buy) or B (Buy). Click here to explore more Software - SAAS stocks.
What To Do Next?
Get your hands on this special report with 3 low priced companies with tremendous upside potential even in today’s volatile markets:
3 Stocks to DOUBLE This Year >
INFA shares were trading at $27.53 per share on Friday morning, up $0.44 (+1.62%). Year-to-date, INFA has gained 69.00%, versus a 21.06% rise in the benchmark S&P 500 index during the same period.
About the Author: Anushka Dutta

Anushka is an analyst whose interest in understanding the impact of broader economic changes on financial markets motivated her to pursue a career in investment research.
The post Informatica (INFA): A Software Gem Ready to Surge - Here's Why appeared first on StockNews.com