


Fintech provider SoFi Technologies Inc. (NASDAQ: SOFI) is a one-stop shop for financial services conveniently accessible around the clock through its mobile-first platform and online. The financial service sector company targets millennials and Gen-Z customers, courting them early in their financial journey with student loans and offering banking, lending, investing, financial planning and wealth management services throughout their careers, fostering generational customers. Sofi expects 20% to 25% compound revenue growth from 2023 through 2026.
Sofi has an FDIC bank charter like Block Inc. (NYSE: SQ) and competes with traditional banks like Bank of America (NYSE: BAC) and Wells Fargo & Co. (NYSE: WFC) as well as neobanks like Chime, Current and Ally Financial Inc. (NYSE: ALLY) Ally Invest.
$750 Million Convertible Debt Offering Sinks Shares
The company scored another solid earnings beat and raise for its Q4 2023 earnings report. Shares initially surged up to $9.42, gapping over 20%, but have since fallen below pre-earnings levels, providing another potential buying opportunity for investors. The fall-off accelerated after announcing its $750 million in unsecured convertible senior notes. They will be privately offered.
The unsecured and unsubordinated notes will accrue 1.25% annual interest payable semi-monthly in arrears commencing on September 15, 2024. The purchaser has the option to purchase up to $112.5 million of notes within 13 days of the note's first issue. The notes mature on March 15, 2029. The initial conversion price works out to approximately $9.45 per share of SOFI Commons stock.
Breaking Records All-Around
On January 29, 2024, SoFi reported its first GAAP EPS of 2 cents, beating consensus analyst expectations by 2 cents. Adjusted EBITDA rose 159% YoY to $181 million and reached its 30% year-end target margin. Positive GAAP net income was $48 million. Revenues surged 35% YoY to $615.4 million, beating $572.02 million analyst estimates.
Sofi added 585,000 new members in Q4 2023, growing total membership by 44% YoY to over 7.5 million. Total product adds rose 41% YoY to 11.1 million. Deposit grew 19% at $2.9 billion to $18.6 billion. A diversification milestone was met with 40% of Q4 2023 adjusted net revenues from its technology platform and financial services segment. Its Technology Platform hit record net revenues of $96.9 million in the quarter and $352.3 million for 2023.
Sandbagging and Raising the Bar
SoFi sees Q1 2024 revenues of $550 million to $560 million, falling short of the $577.52 million consensus analyst estimates. Investors didn’t buy the lowered guidance and bid up the shares. Full year 2024 EPS is expected between 7 cents to 8 cents versus 5 cents consensus estimates.
The Network Effect is Driving the Flywheel
Cross-selling products under the Sofi brand on a single platform is the synergy that drives the flywheel. Customers that take student loans or personal loans or SoFi Credit Card may set up direct deposits and bank services through SoFi Money, which then leads them to Sofi Invest and financial planning services and SoFi Relay budget planner and money tracker to track all the money in one place. SoFi Relay users rose by 74% YoY. Users may be interested in insurance services through SoFi’s collaboration with Lemonade Inc. (NYSE: LMND). This is underscored by the 30% of all products purchased are from existing customers.
Some Lurking Charge-Off Concerns
While the headline numbers are appealing, a deeper read into some segment metrics raises concerns among analysts. While the company purports the higher quality of its customer's FICO scores, averaging 745 on deposits, it is worth noting the rising charge-off rates for personal loans rose to 3.4%, up from 1% in 2021. The average personal loan outstanding surged from $2 billion in 2021 to $13 billion in 2023.
Credit card charge loan charge-offs rose to 17%, up from 4% in 2021, as outstanding loans rose to $239 million in 2023 from $48 million in 2021. Sofi also has a feature where borrowers can buy down interest rates on their loans with an upfront payment. This has the potential smell of channel stuffing as fees are front-loaded and look great upfront, but it can impact financing income in times.
SoFi CEO Insights
SoFi CEO Anthony Noto commented on the network effect, “More than half of newly funded SoFi Money accounts are setting up direct deposit by day 30, which has had a significant impact on debit spending, which exceeded $1.5 billion in quarterly debit transaction volume and was up nearly threefold year-over-year, representing more than $6 billion of annualized debit transaction volume. Importantly, and as anticipated, we also benefit from continued strong cross-buy trends from this attractive member base into Lending and other Financial Services products.”
Noto noted its loan demand is very strong despite high-interest rates and inflation. Since its customers tend to have higher credit quality and higher incomes, they tend to be less impacted by financial headwinds.
Morgan Stanley Downgrade for SoFi
Morgan Stanley downgraded shares of SOFI to Underweight from Equal-Weight, lowering its price target to $6.50 from $7.00 based on slowing top-line growth and execution rise on the path to 2026 EPS. The same analyst that upgraded SOFI after its Q3 2023 earnings downgraded shares after the 20% price gain since. Analyst Jeffrey Adelson believes "… the stock is pricing in too much optimism." Adelson thinks there's more downside risk than upside gain in the medium-term outlook.
SoFi Technologies analyst ratings and price targets can be found on MarketBeat. SoFi Technologies peers and competitor stocks can be found with the MarketBeat stock screener.
Daily Ascending Triangle Breakdown
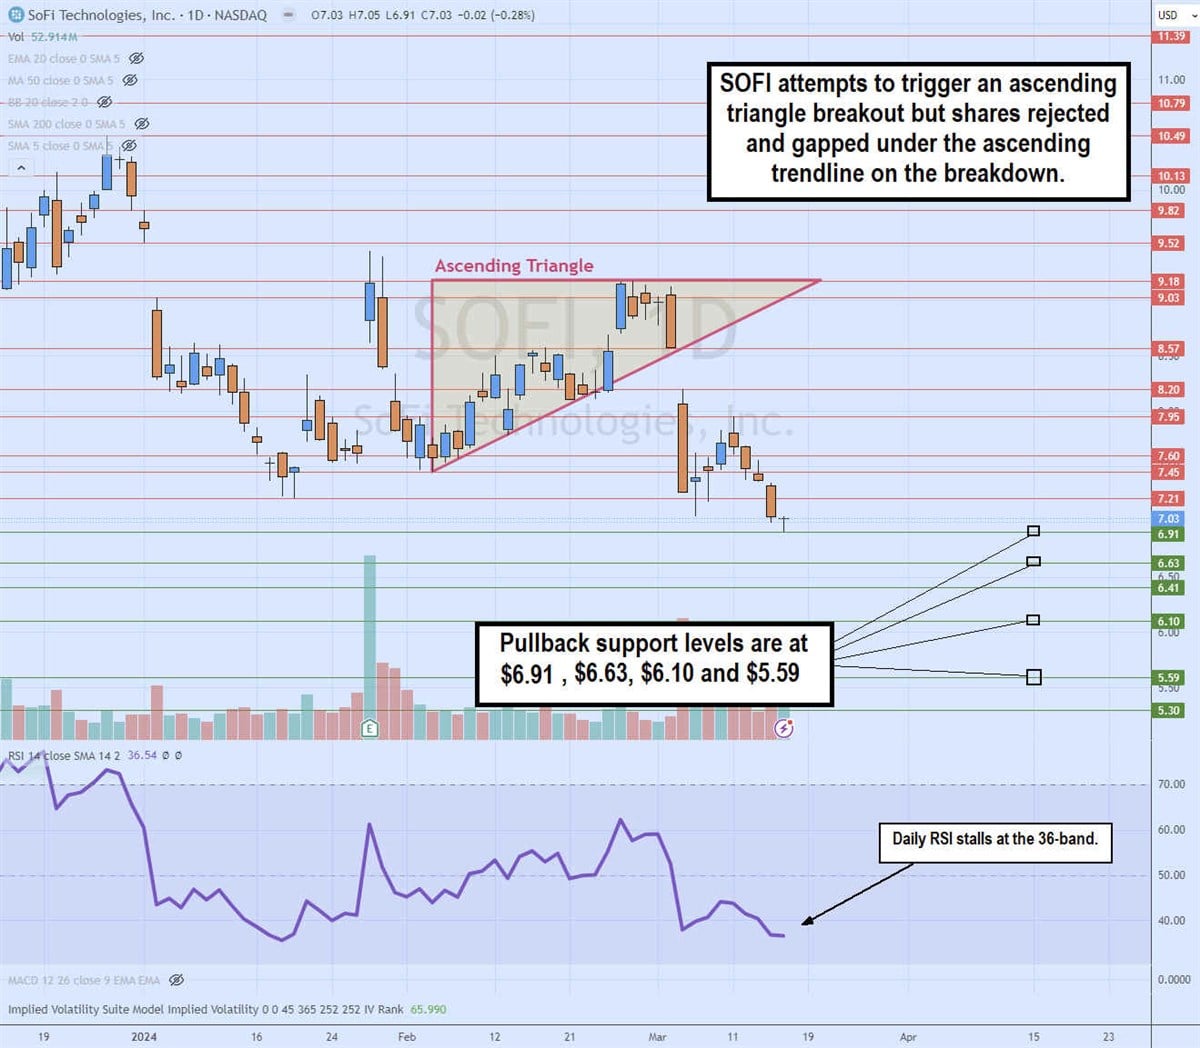
The daily candlestick chart on SOFI formed an ascending triangle pattern breakdown. The ascending (rising) lower trendline formed at $7.45 on February 5, 2024. Pullbacks were supported on higher lows, closing the channel with the flat-top upper trendline at $9.18. After multiple attempts to break failed, shares gapped down on March 5, 2024, below the ascending trendline as shares proceeded to sell off after another failed attempt to bounce, peaking out at $7.95.
The daily relative strength index (RSI) lost steam as it fell back down to the 36-band. Pullback support levels are at $6.91, $6.63, $6.10 and $5.59.
