Industrial cleaning equipment manufacturer Tennant Company fell short of the market’s revenue expectations in Q3 CY2024 as sales rose 3.6% year on year to $315.8 million. On the other hand, the company’s outlook for the full year was close to analysts’ estimates with revenue guided to $1.29 billion at the midpoint. Its GAAP profit of $1.09 per share was also 4.4% below analysts’ consensus estimates.
Is now the time to buy Tennant? Find out by accessing our full research report, it’s free.
Tennant (TNC) Q3 CY2024 Highlights:
- Revenue: $315.8 million vs analyst estimates of $319.4 million (1.1% miss)
- EPS: $1.09 vs analyst expectations of $1.14 (4.4% miss)
- EBITDA: $47.9 million vs analyst estimates of $49.1 million (2.4% miss)
- The company reconfirmed its revenue guidance for the full year of $1.29 billion at the midpoint
- EBITDA guidance for the full year is $210 million at the midpoint, below analyst estimates of $211.7 million
- Gross Margin (GAAP): 42.4%, in line with the same quarter last year
- Operating Margin: 9.7%, down from 11.4% in the same quarter last year
- EBITDA Margin: 15.2%, in line with the same quarter last year
- Free Cash Flow Margin: 8.4%, down from 16.7% in the same quarter last year
- Market Capitalization: $1.70 billion
“We are pleased to report Tennant's strong third quarter results, continuing the trend from the first half of 2024 of delivering growth in organic net sales and Adjusted EBITDA as we progress toward normalized backlog levels by the end of 2024," said Dave Huml, Tennant President and Chief Executive Officer.
Company Overview
As the world’s largest manufacturer of autonomous mobile robots, Tennant (NYSE:TNC) designs, manufactures, and sells cleaning products to various sectors.
Water Infrastructure
Trends towards conservation and reducing groundwater depletion are putting water infrastructure and treatment products front and center. Companies that can innovate and create solutions–especially automated or connected solutions–to address these thematic trends will create incremental demand and speed up replacement cycles. On the other hand, water infrastructure and treatment companies are at the whim of economic cycles. Consumer spending and interest rates, for example, can greatly impact the industrial production that drives demand for these companies’ offerings.
Sales Growth
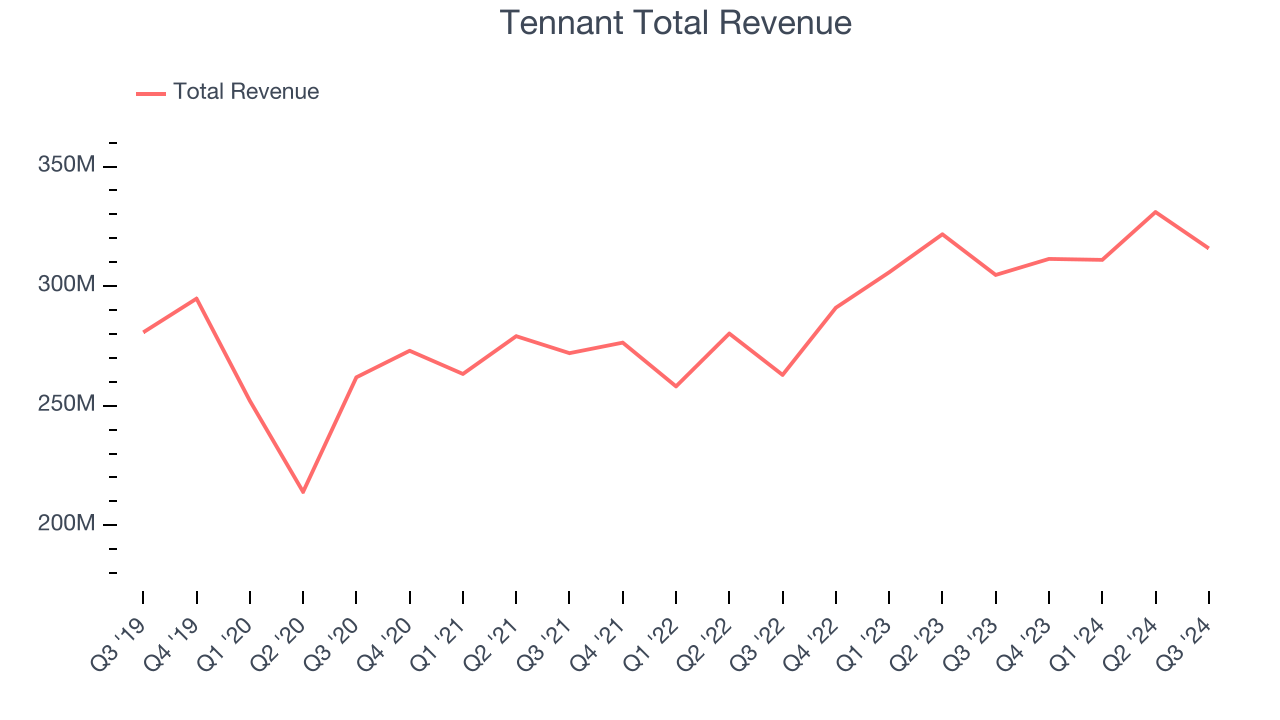
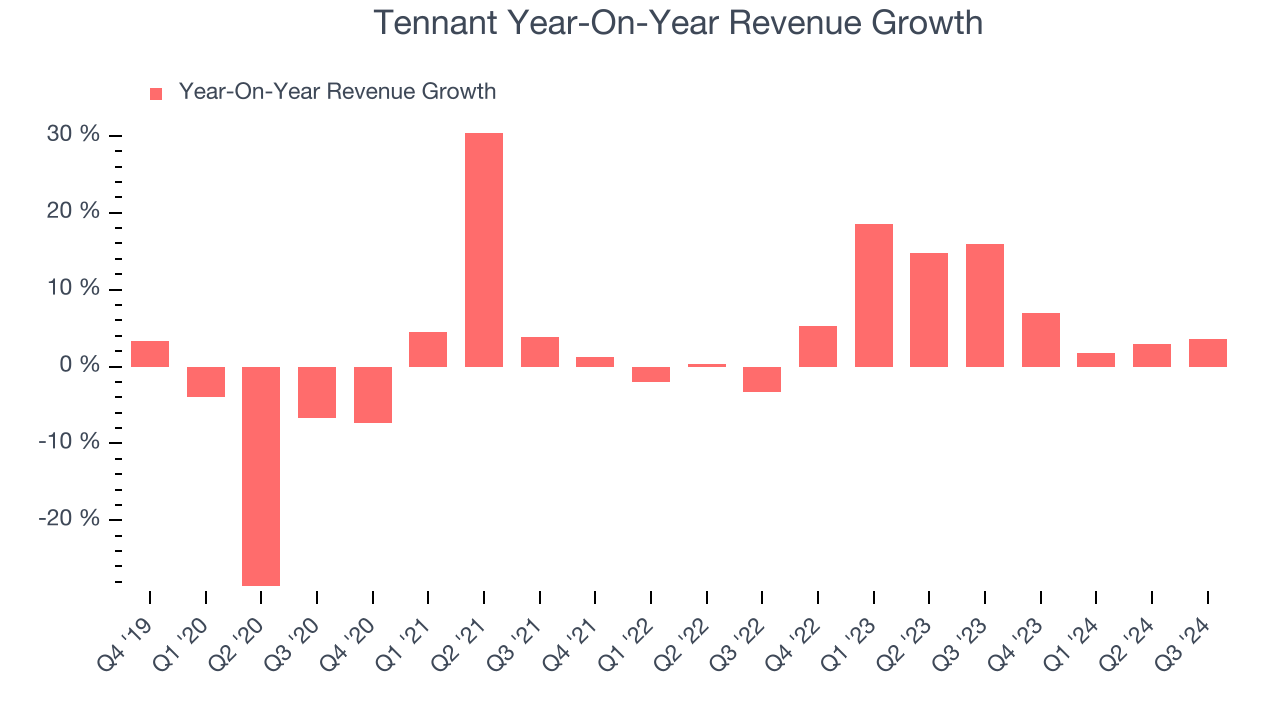
Examining a company’s long-term performance can provide clues about its business quality. Any business can put up a good quarter or two, but the best consistently grow over the long haul. Unfortunately, Tennant’s 2.4% annualized revenue growth over the last five years was sluggish. This shows it failed to expand in any major way, a rough starting point for our analysis.

Long-term growth is the most important, but within industrials, a half-decade historical view may miss new industry trends or demand cycles. Tennant’s annualized revenue growth of 8.5% over the last two years is above its five-year trend, suggesting some bright spots. 
This quarter, Tennant’s revenue grew 3.6% year on year to $315.8 million, falling short of Wall Street’s estimates.
Looking ahead, sell-side analysts expect revenue to grow 5.1% over the next 12 months, a deceleration versus the last two years. This projection is underwhelming and illustrates the market thinks its products and services will see some demand headwinds.
Today’s young investors won’t have read the timeless lessons in Gorilla Game: Picking Winners In High Technology because it was written more than 20 years ago when Microsoft and Apple were first establishing their supremacy. But if we apply the same principles, then enterprise software stocks leveraging their own generative AI capabilities may well be the Gorillas of the future. So, in that spirit, we are excited to present our Special Free Report on a profitable, fast-growing enterprise software stock that is already riding the automation wave and looking to catch the generative AI next.
Operating Margin
Operating margin is a key measure of profitability. Think of it as net income–the bottom line–excluding the impact of taxes and interest on debt, which are less connected to business fundamentals.
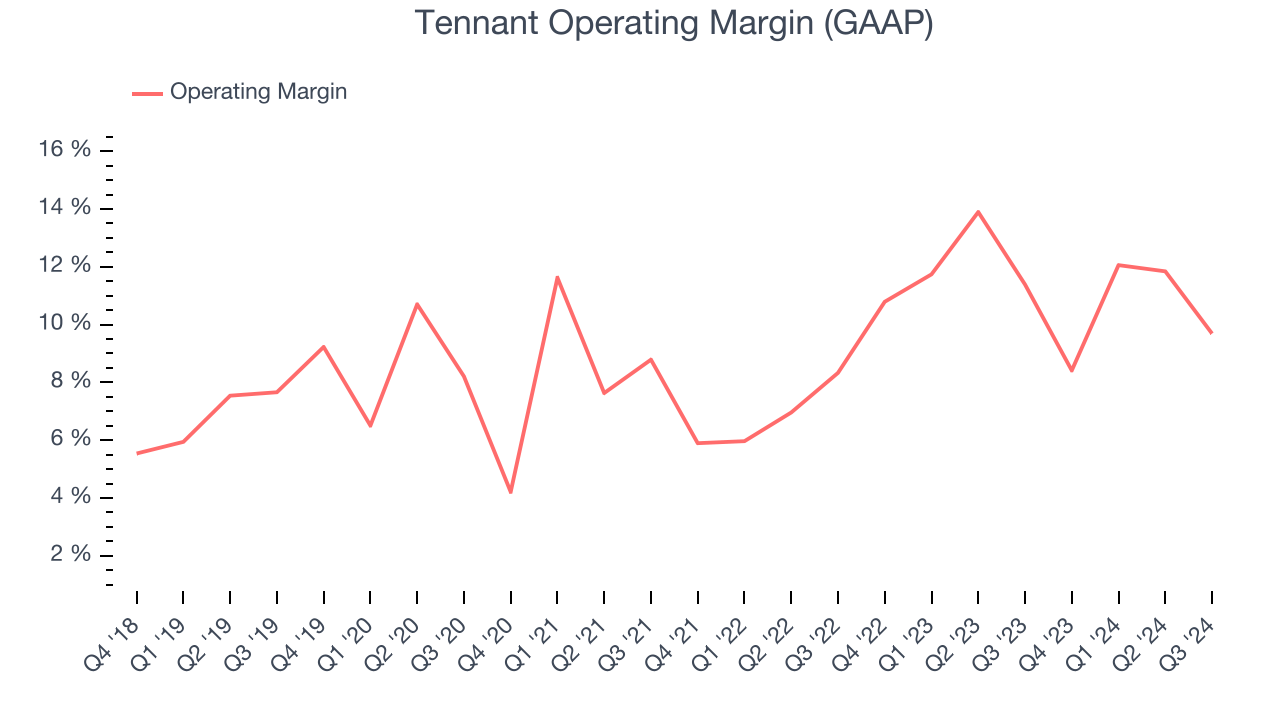
Tennant has done a decent job managing its cost base over the last five years. The company has produced an average operating margin of 9.3%, higher than the broader industrials sector.
Looking at the trend in its profitability, Tennant’s annual operating margin rose by 1.9 percentage points over the last five years, showing its efficiency has improved.

In Q3, Tennant generated an operating profit margin of 9.7%, down 1.7 percentage points year on year. Since Tennant’s operating margin decreased more than its gross margin, we can assume it was recently less efficient because expenses such as marketing, R&D, and administrative overhead increased.
Earnings Per Share
Analyzing revenue trends tells us about a company’s historical growth, but the long-term change in its earnings per share (EPS) points to the profitability of that growth – for example, a company could inflate its sales through excessive spending on advertising and promotions.
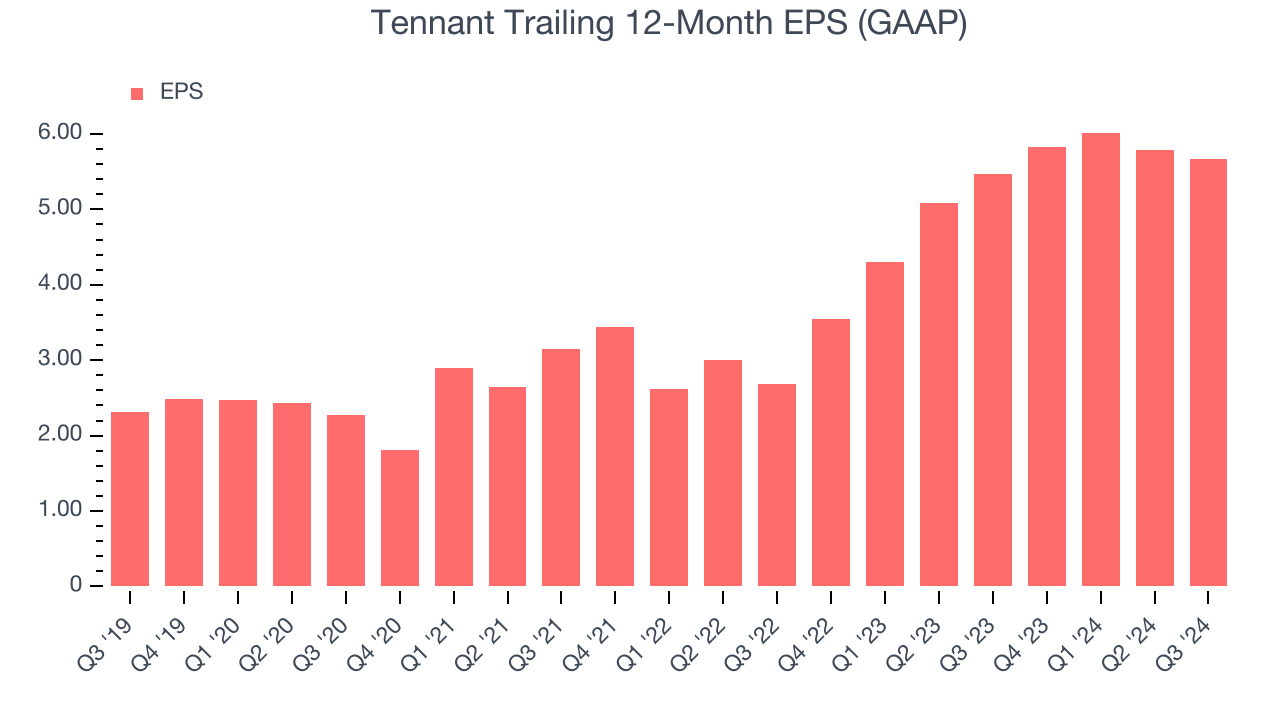
Tennant’s EPS grew at an astounding 19.7% compounded annual growth rate over the last five years, higher than its 2.4% annualized revenue growth. This tells us the company became more profitable as it expanded.

Diving into the nuances of Tennant’s earnings can give us a better understanding of its performance. As we mentioned earlier, Tennant’s operating margin declined this quarter but expanded by 1.9 percentage points over the last five years. This was the most relevant factor (aside from the revenue impact) behind its higher earnings; taxes and interest expenses can also affect EPS but don’t tell us as much about a company’s fundamentals.
Like with revenue, we analyze EPS over a more recent period because it can give insight into an emerging theme or development for the business.
For Tennant, its two-year annual EPS growth of 45.2% was higher than its five-year trend. We love it when earnings growth accelerates, especially when it accelerates off an already high base.In Q3, Tennant reported EPS at $1.09, down from $1.21 in the same quarter last year. This print missed analysts’ estimates, but we care more about long-term EPS growth than short-term movements. Over the next 12 months, Wall Street expects Tennant’s full-year EPS of $5.67 to shrink by 15.9%.
Key Takeaways from Tennant’s Q3 Results
We struggled to find many strong positives in these results. Its EPS missed and its revenue fell short of Wall Street’s estimates. That the company reaffirmed its full year EPS guidance shows that it is still on track, but overall, this was a softer quarter. The stock remained flat at $86.64 immediately following the results.
Tennant underperformed this quarter, but does that create an opportunity to invest right now? When making that decision, it’s important to consider its valuation, business qualities, as well as what has happened in the latest quarter. We cover that in our actionable full research report which you can read here, it’s free.


