


Investors are worried that the post-pandemic travel boom might slow down if the economy shows signs of strain, potentially impacting the U.S. airline sector. With high inflationary pressures and ticket prices, airliners have mitigated cost increases. However, falling ticket prices could put a stop to that hedge against rising costs.
Against this backdrop, American Airlines Group Inc. (AAL) recently reported a year-over-year decline in its bottom line for the third quarter ended September 30. The company also trimmed its profit forecast from $3-$3.75 to the $2.25-$2.50 range.
The company reported a $13.48 billion total operating revenue, missing analysts’ expected figure of $13.52 billion. However, AAL’s adjusted EPS of $0.38 topped the $0.25 analyst estimate.
Looking at this scenario, it seems imperative to look at the trends of AAL’s key financial metrics to understand why it could be wise to wait for a better entry point in the stock.
Financial Oscillations for American Airlines: A Review from 2021 to 2023
The trailing-12-month net income of AAL exhibited a definitive upward trend from December 31, 2020, to September 30, 2023.
- On December 31, 2020, the net income stood at negative $8.89 billion, highlighting significant losses.
- This trend continued into the first quarter of 2021, with a slightly reduced loss of $7.89 billion in March.
- By the end of the second quarter of 2021, on June 30, an improvement was noted as the losses lessened to $5.81 billion.
- The third quarter of 2021 showed a further reduction in losses, with a negative $3.24 billion in September.
- The net income improved noticeably by the end of 2021, closing at a negative $1.99 billion in December.
- Despite a small relapse to negative $2.38 billion in the first quarter of 2022, the overall improvement observed in 2021 was maintained throughout 2022 and 2023.
- The company posted its first profit on December 31, 2022, with a net income of $127 million.
- Subsequently, profits increased significantly throughout 2023, peaking at $2.63 billion in June before tempering slightly to $1.61 billion in September.
The growth rate measured from the last value to the first reflects a remarkable turnaround for AAL, from substantial losses in 2020 to returning to profitability by late 2022 and sustaining the positive trajectory in 2023.
It should be taken into account that the emphasis is placed greatly on the more recent data, particularly the last reported figure in September 2023, which exhibited a positive net income of $1.61 billion.

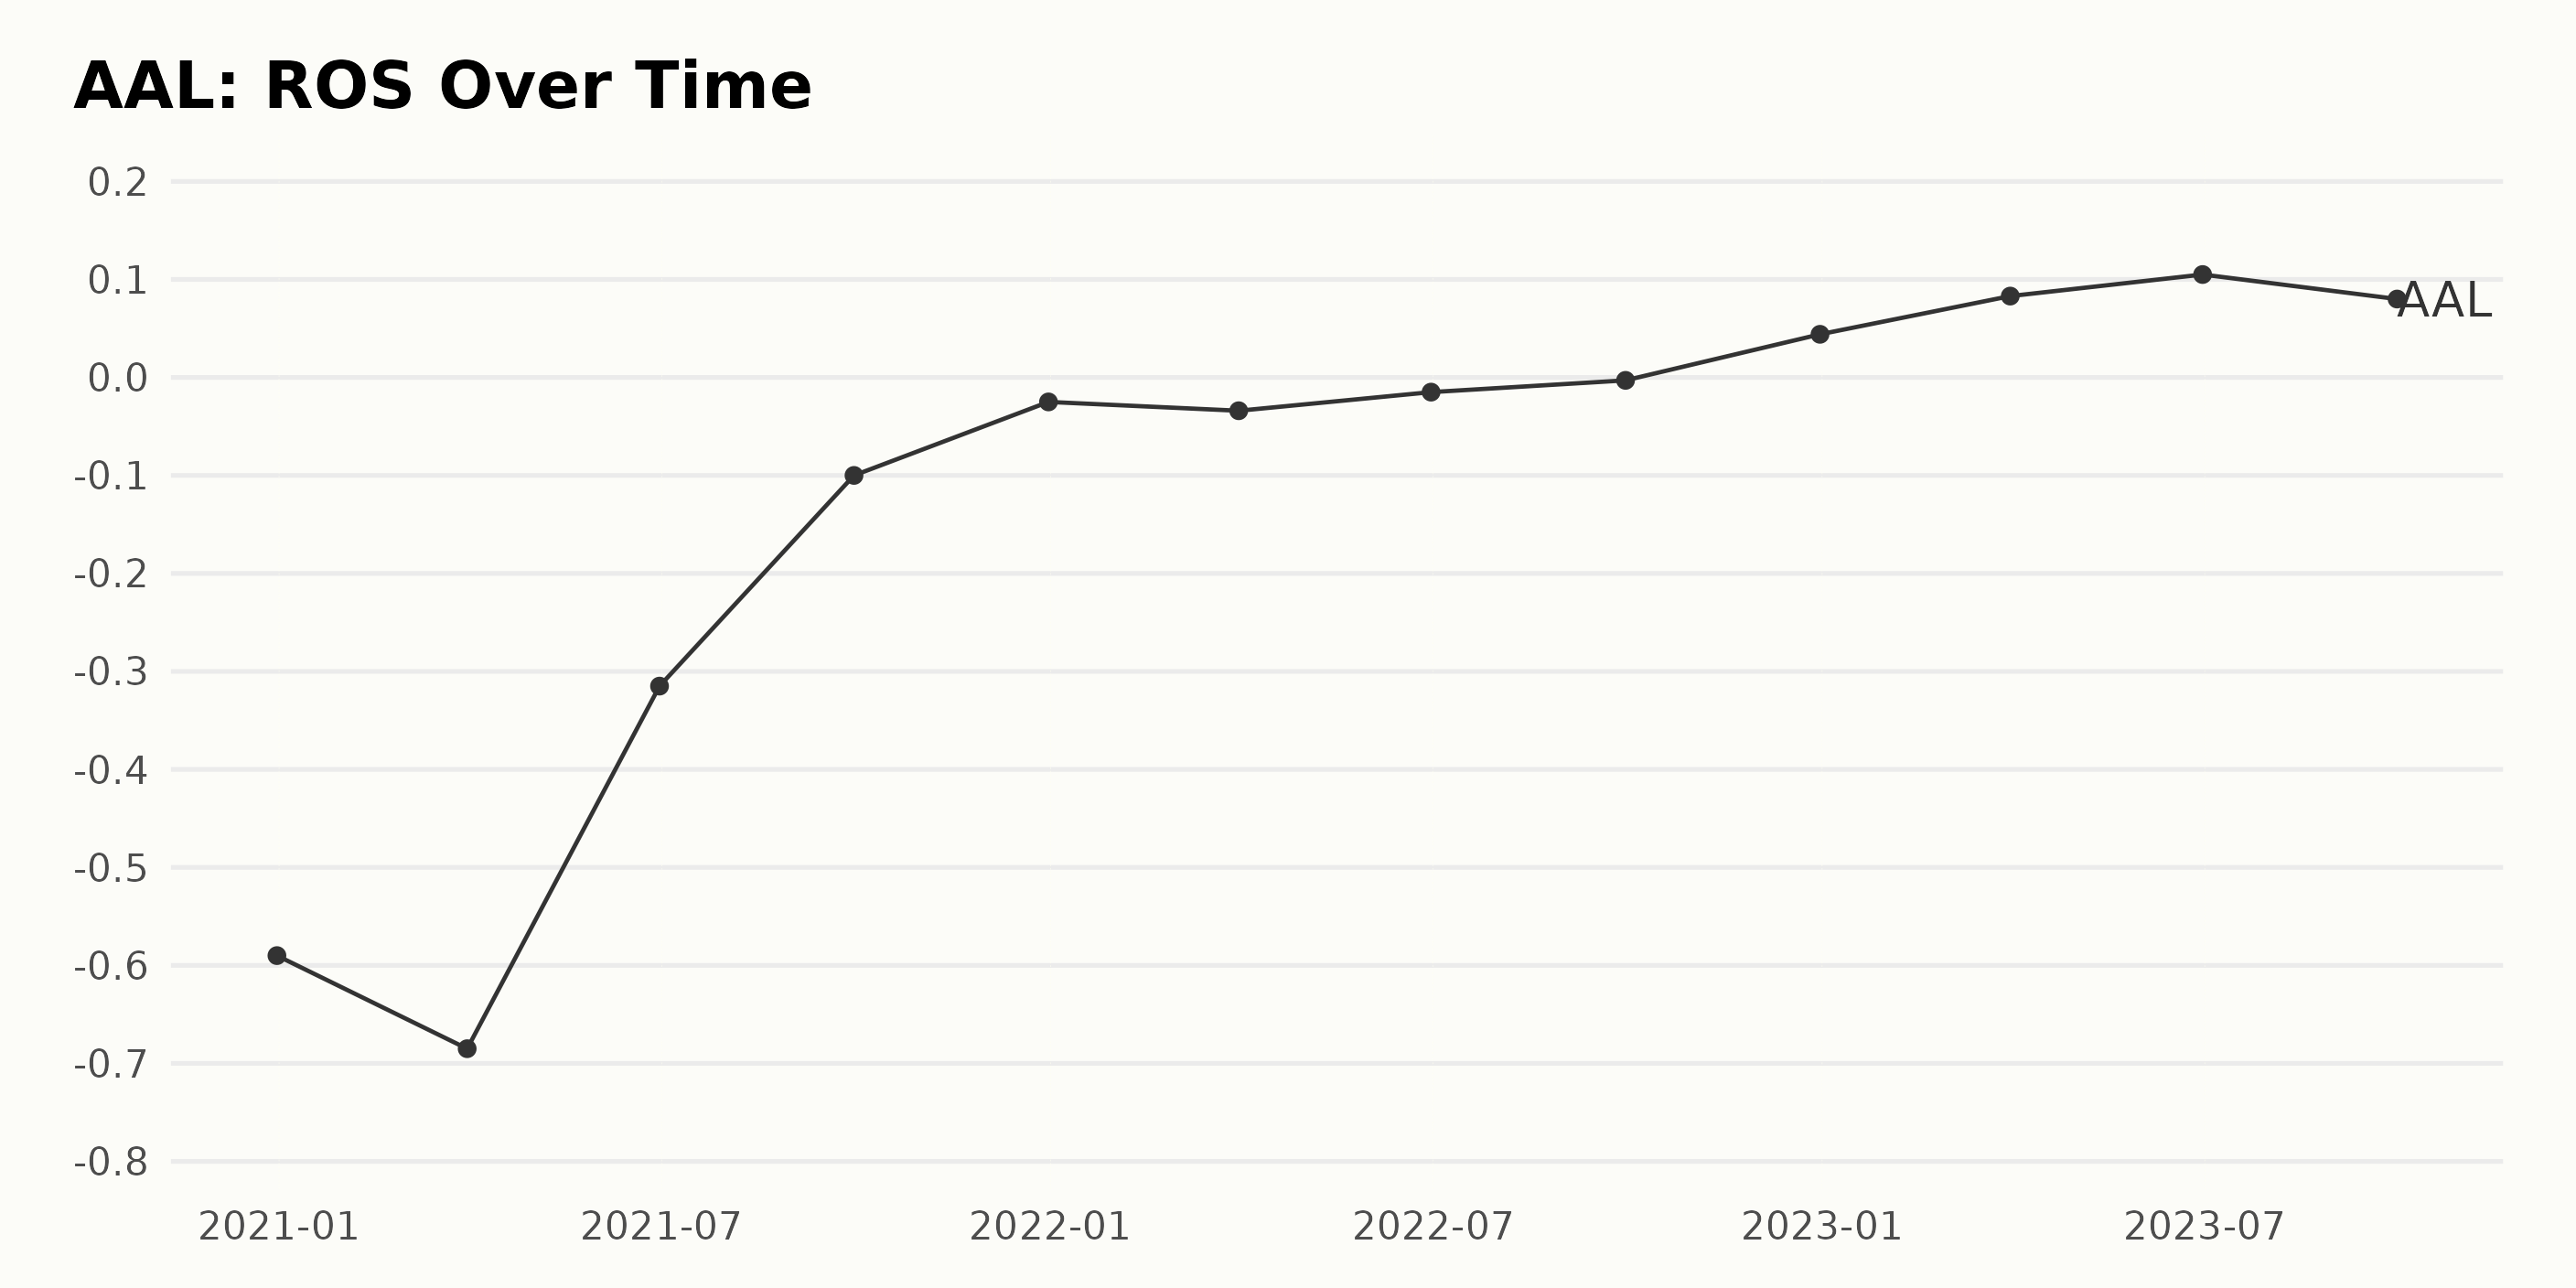
The data series represents AAL's reported Return On Sales (ROS) between December 31, 2020, and September 30, 2023. Below are the highlights of the trend and fluctuations:
- As of December 31, 2020, the AAL had a ROS of -0.59, indicating a negative return.
- Over the first three months of 2021 (ending March 31), the ROS further dropped to -0.685. However, since then, there has been a clear upward trend in the firm's performance, with the ROS consistently improving over subsequent periods.
- The company returned to positive ROS figures by December 31, 2022, with an ROS value of 0.044.
- Subsequently, the ROS continued to rise, peaking at 0.105 on June 30, 2023.
- As of the latest data point, September 30, 2023, the ROS stands at 0.08.
Ultimately, from December 2020 to the end of September 2023, the ROS went from -0.59 to 0.08, signifying a substantial improvement in AAL's operating efficiency during this period.
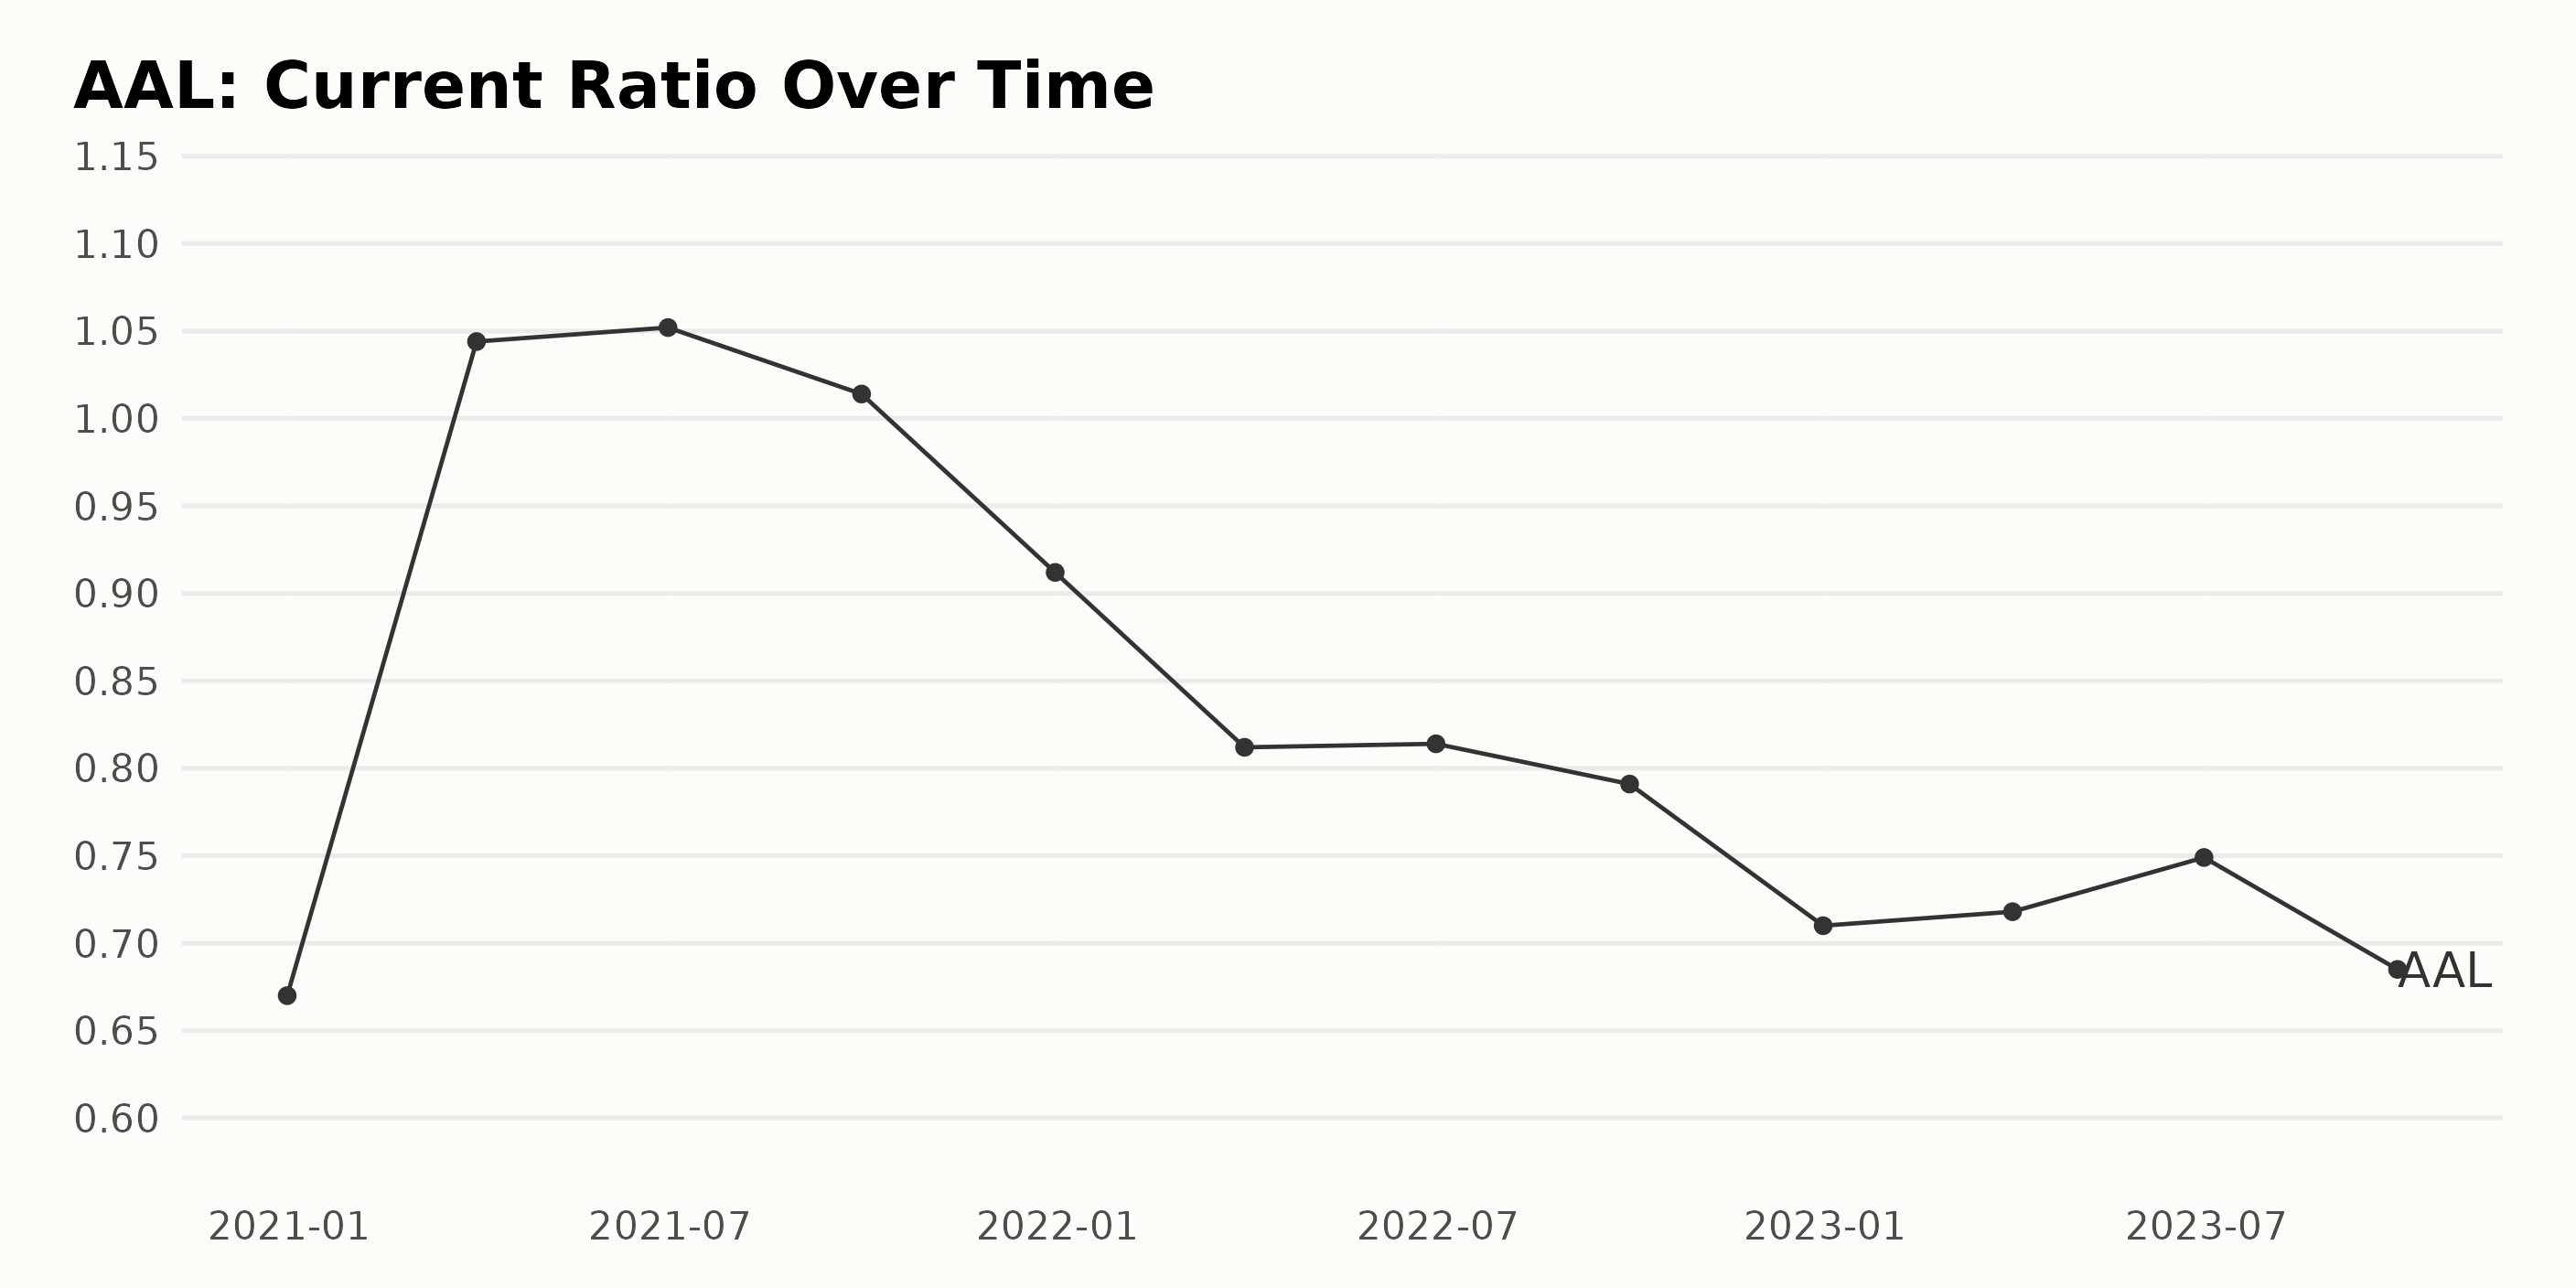
Below is a summary of AAL's current ratio trends and fluctuations based on the provided data series:
- On December 31, 2020, the current ratio for AAL was 0.67.
- The subsequent quarters in 2021 showed an initial increase in the current ratio, reaching its peak value of 1.052 on June 30, 2021.
- This upward trend was short-lived as the ratio began to decline from September 2021, finishing the year at 0.912.
- The recent trends and highlights (2022 to 2023) are as follows:
- The current ratio has generally shown a downward trend from the beginning of 2022 to September 30, 2023.
- Despite minor fluctuations, such as a slight increase to 0.814 on June 30, 2022, and another rise to 0.749 on June 30, 2023, the overall movement is decreasing.
- As of the final reported period on September 30, 2023, the current ratio stood at 0.685.
Growth Rate: The growth rate, calculated by measuring the first value from the last value, shows a decrease in the current ratio by approximately -0.02 or -2.99% over the entirety of the observed period.
This analysis emphasizes more recent data alongside the fluctuations and indicates a trend of decreasing liquidity as per the current ratio for AAL. Monitoring this trend and its business implications should be a priority.
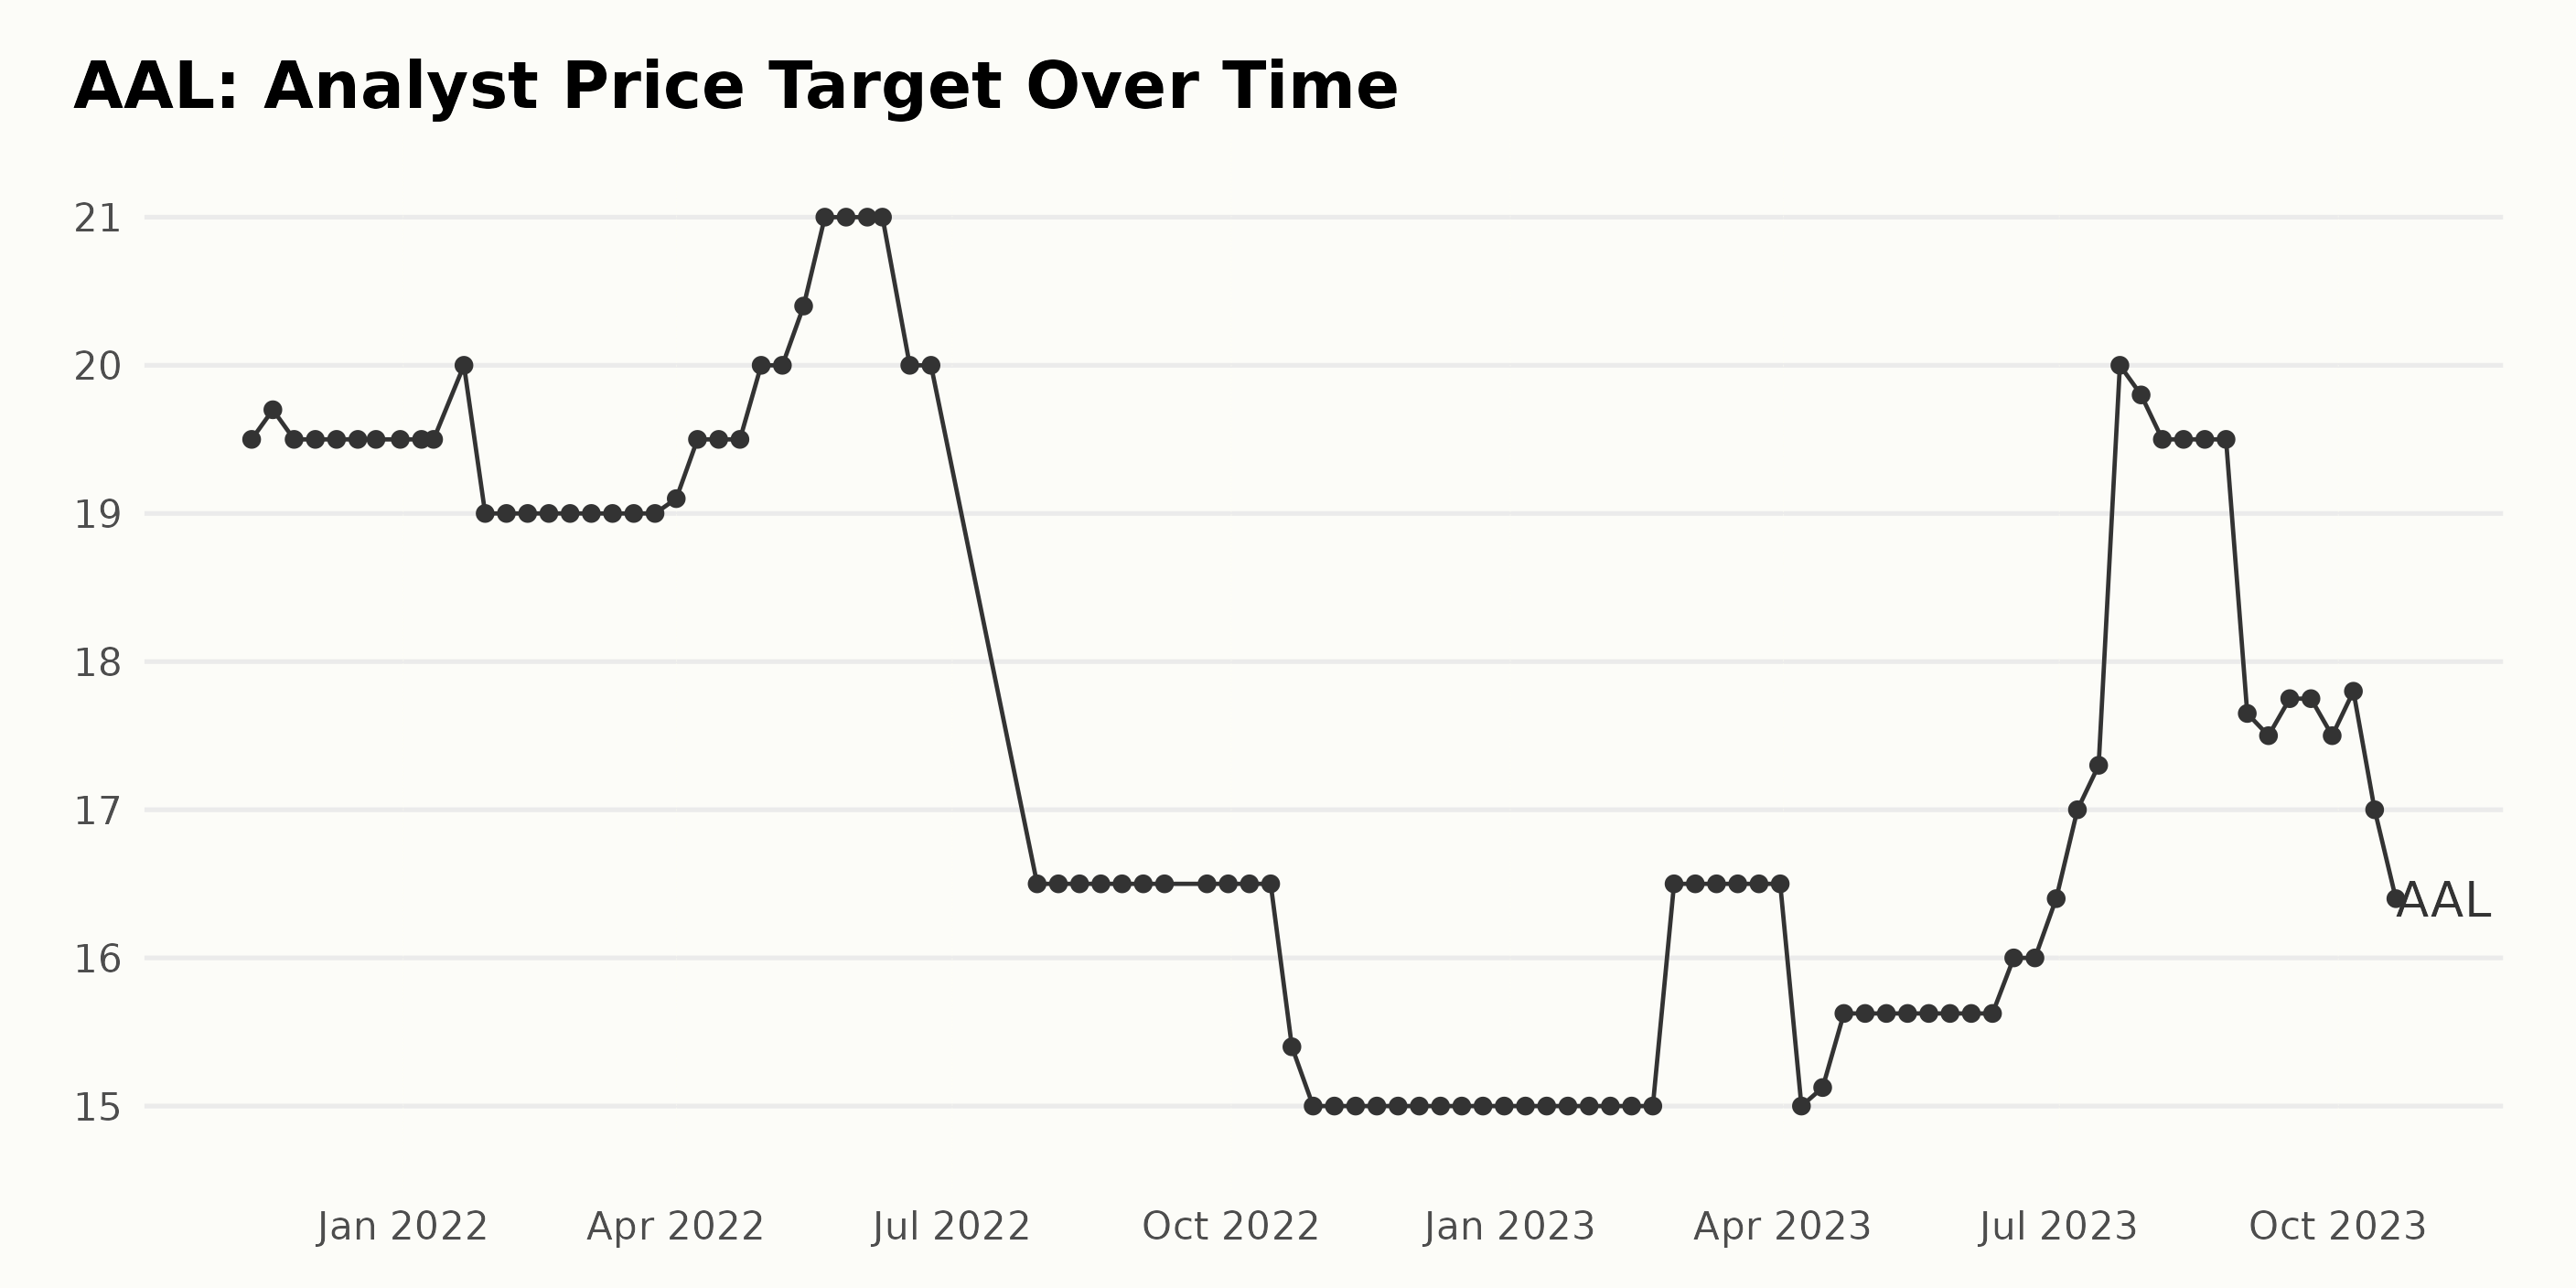
The analyst price target for AAL showed significant fluctuations from November 2021 to October 2023. Here are key points summarizing the trend and variations:
- Starting from a value of $19.5 on November 12, 2021, the price target experienced minor fluctuations until reaching its local peak of $21 in May 2022.
- This was followed by a swift drop to $16.5 by July 2022, marking a reduction of 21.43% from its previous peak.
- The price target remained steady at $16.5 for nearly two months, then began a downward slope to reach $15 by October 21, 2022.
- It maintained a constant level until February 24, 2023, when it increased back to $16.5, creating an uptick of 10% in comparison to values held since October 2022.
- From April 2023 onward, the series takes an upward trend before experiencing another significant jump to $20 by July 2023.
- However, the price target slid down shortly after, settling at around $17.8 in October 2023.
Looking at the overall trend, the analyst price target decreased from an initial value of $19.5 to a final value of $16.4, marking a total decrease of approximately 15.9%. Recent data holds more weight, and the drop from $19.5 in August 2023 to $16.4 in October 2023 signifies a fairly substantial decrease of 15.9% in recent months, representing a bearish sentiment among analysts for the future performance of AAL.
Six-Month Review: American Airlines Share Price's Rise and Fall in 2023
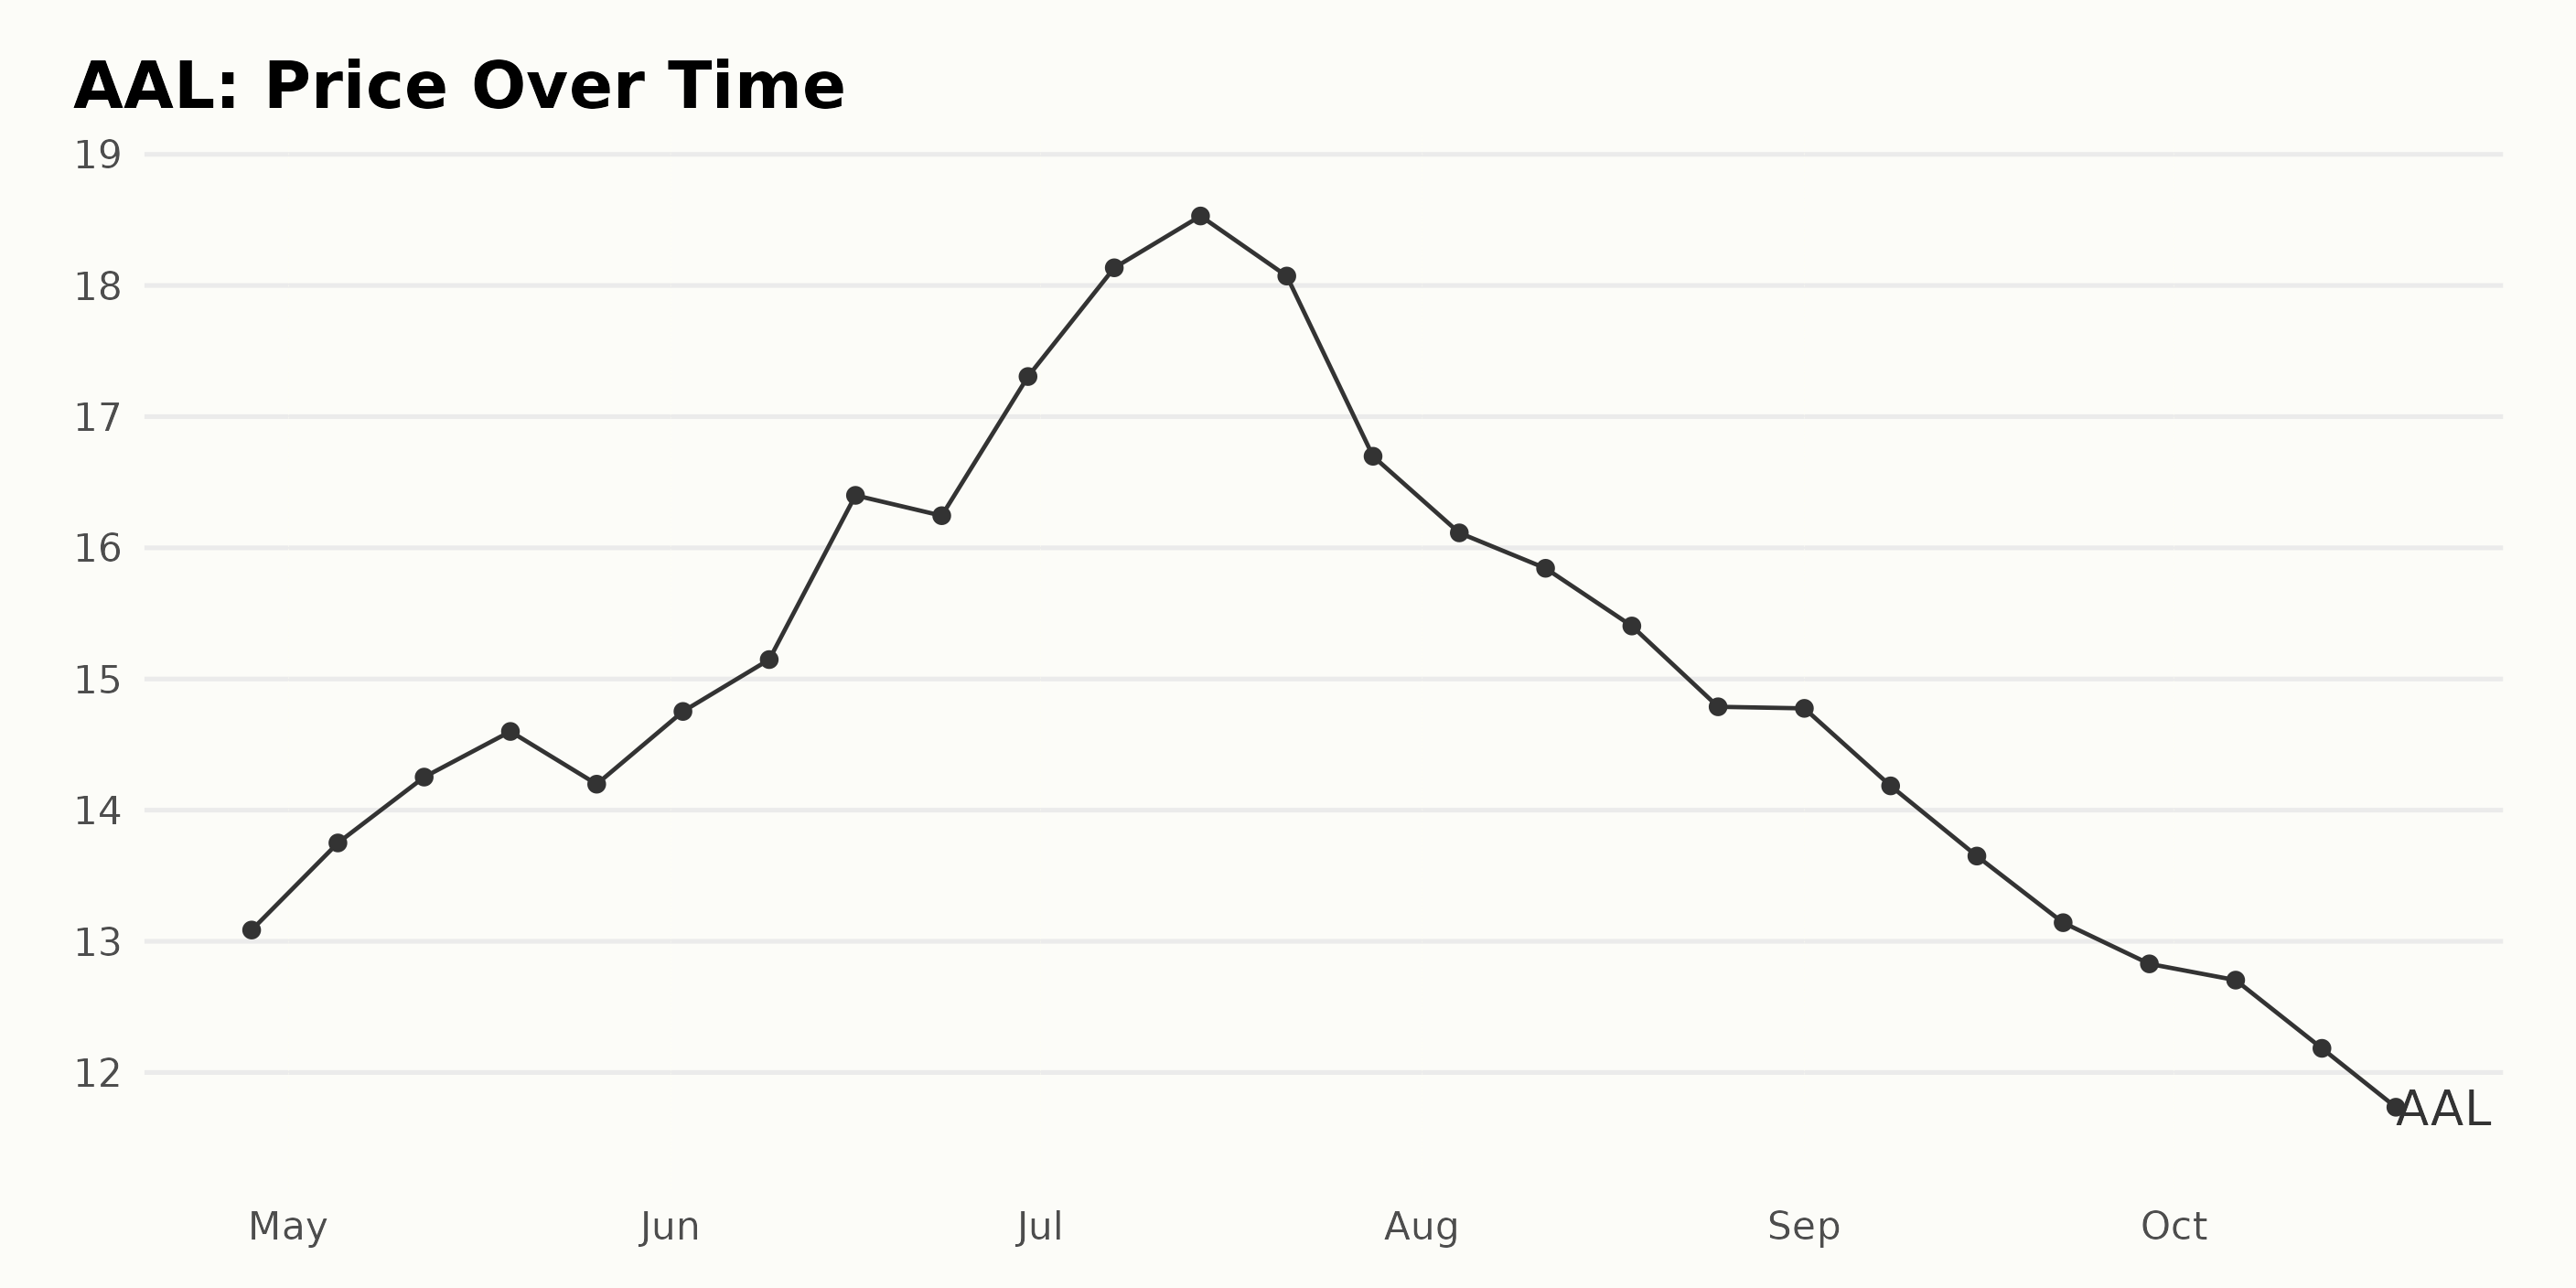
Analyzing the provided data for AAL, it seems that the share prices experienced some fluctuations but overall followed a clear trend from April to October 2023.
- In April 2023, the share price started at $13.09.
- Throughout May, the share price grew steadily week by week, reaching a peak of $14.60 on May 19, 2023, before dropping slightly to $14.20 by the month's end.
- The upward trend continued in June, with the share price progressively rising each week and ultimately hitting its highest value of $17.31 by the end of the month.
- July saw another surge, peaking at $18.53 midway through the month, followed by a gradual decline to $16.70 by its end.
- This decline persisted into August; the share price fell continuously throughout this month, finishing at a low of $14.79.
- September showed a similar trend, with the share price falling further to $12.83 by the end of the month.
- By mid-October, the share price had dropped again, settling at $11.45 in the last trading session.
Overall, it is evident from the data that the shares of AAL went through a phase of growth and then contraction within the six-month timeframe. Initially, the shares experienced a steady acceleration followed by a clear deceleration trend after July. Here is a chart of AAL's price over the past 180 days.
Analyzing American Airlines' POWR Ratings: Growth, Quality, and Value in 2023
As of the latest data on October 19, 2023, AAL, which is among the 28 stocks in the Airlines category, has a POWR Ratings grade of C (Neutral). This denotes an average performance considering various factors analyzed by the POWR grading system. Below is a gradual transition of AAL's POWR grade and rank in the category over the course of several months:
- On April 29, 2023, it held a POWR grade of C (Neutral) and was ranked #11 in the category.
- The company witnessed a steady improvement in May with a grade B (Buy) and ascended to a superior rank of #6 by May 13, 2023.
- This B (Buy) grade persisted through June, July, and most of August despite slight variations in its rank, varying between #8 and #10 mostly.
- However, towards the end of August 2023, its POWR grade fell to C (Neutral) and declined to #12 in the category on August 9, 2023.
- In the following weeks, the rank dropped down to #13 but didn't see much fluctuation until the last recorded date on October 19, 2023.
- As of October 20, the POWR grade stands at C (Neutral), with a rank-in-category of #15.
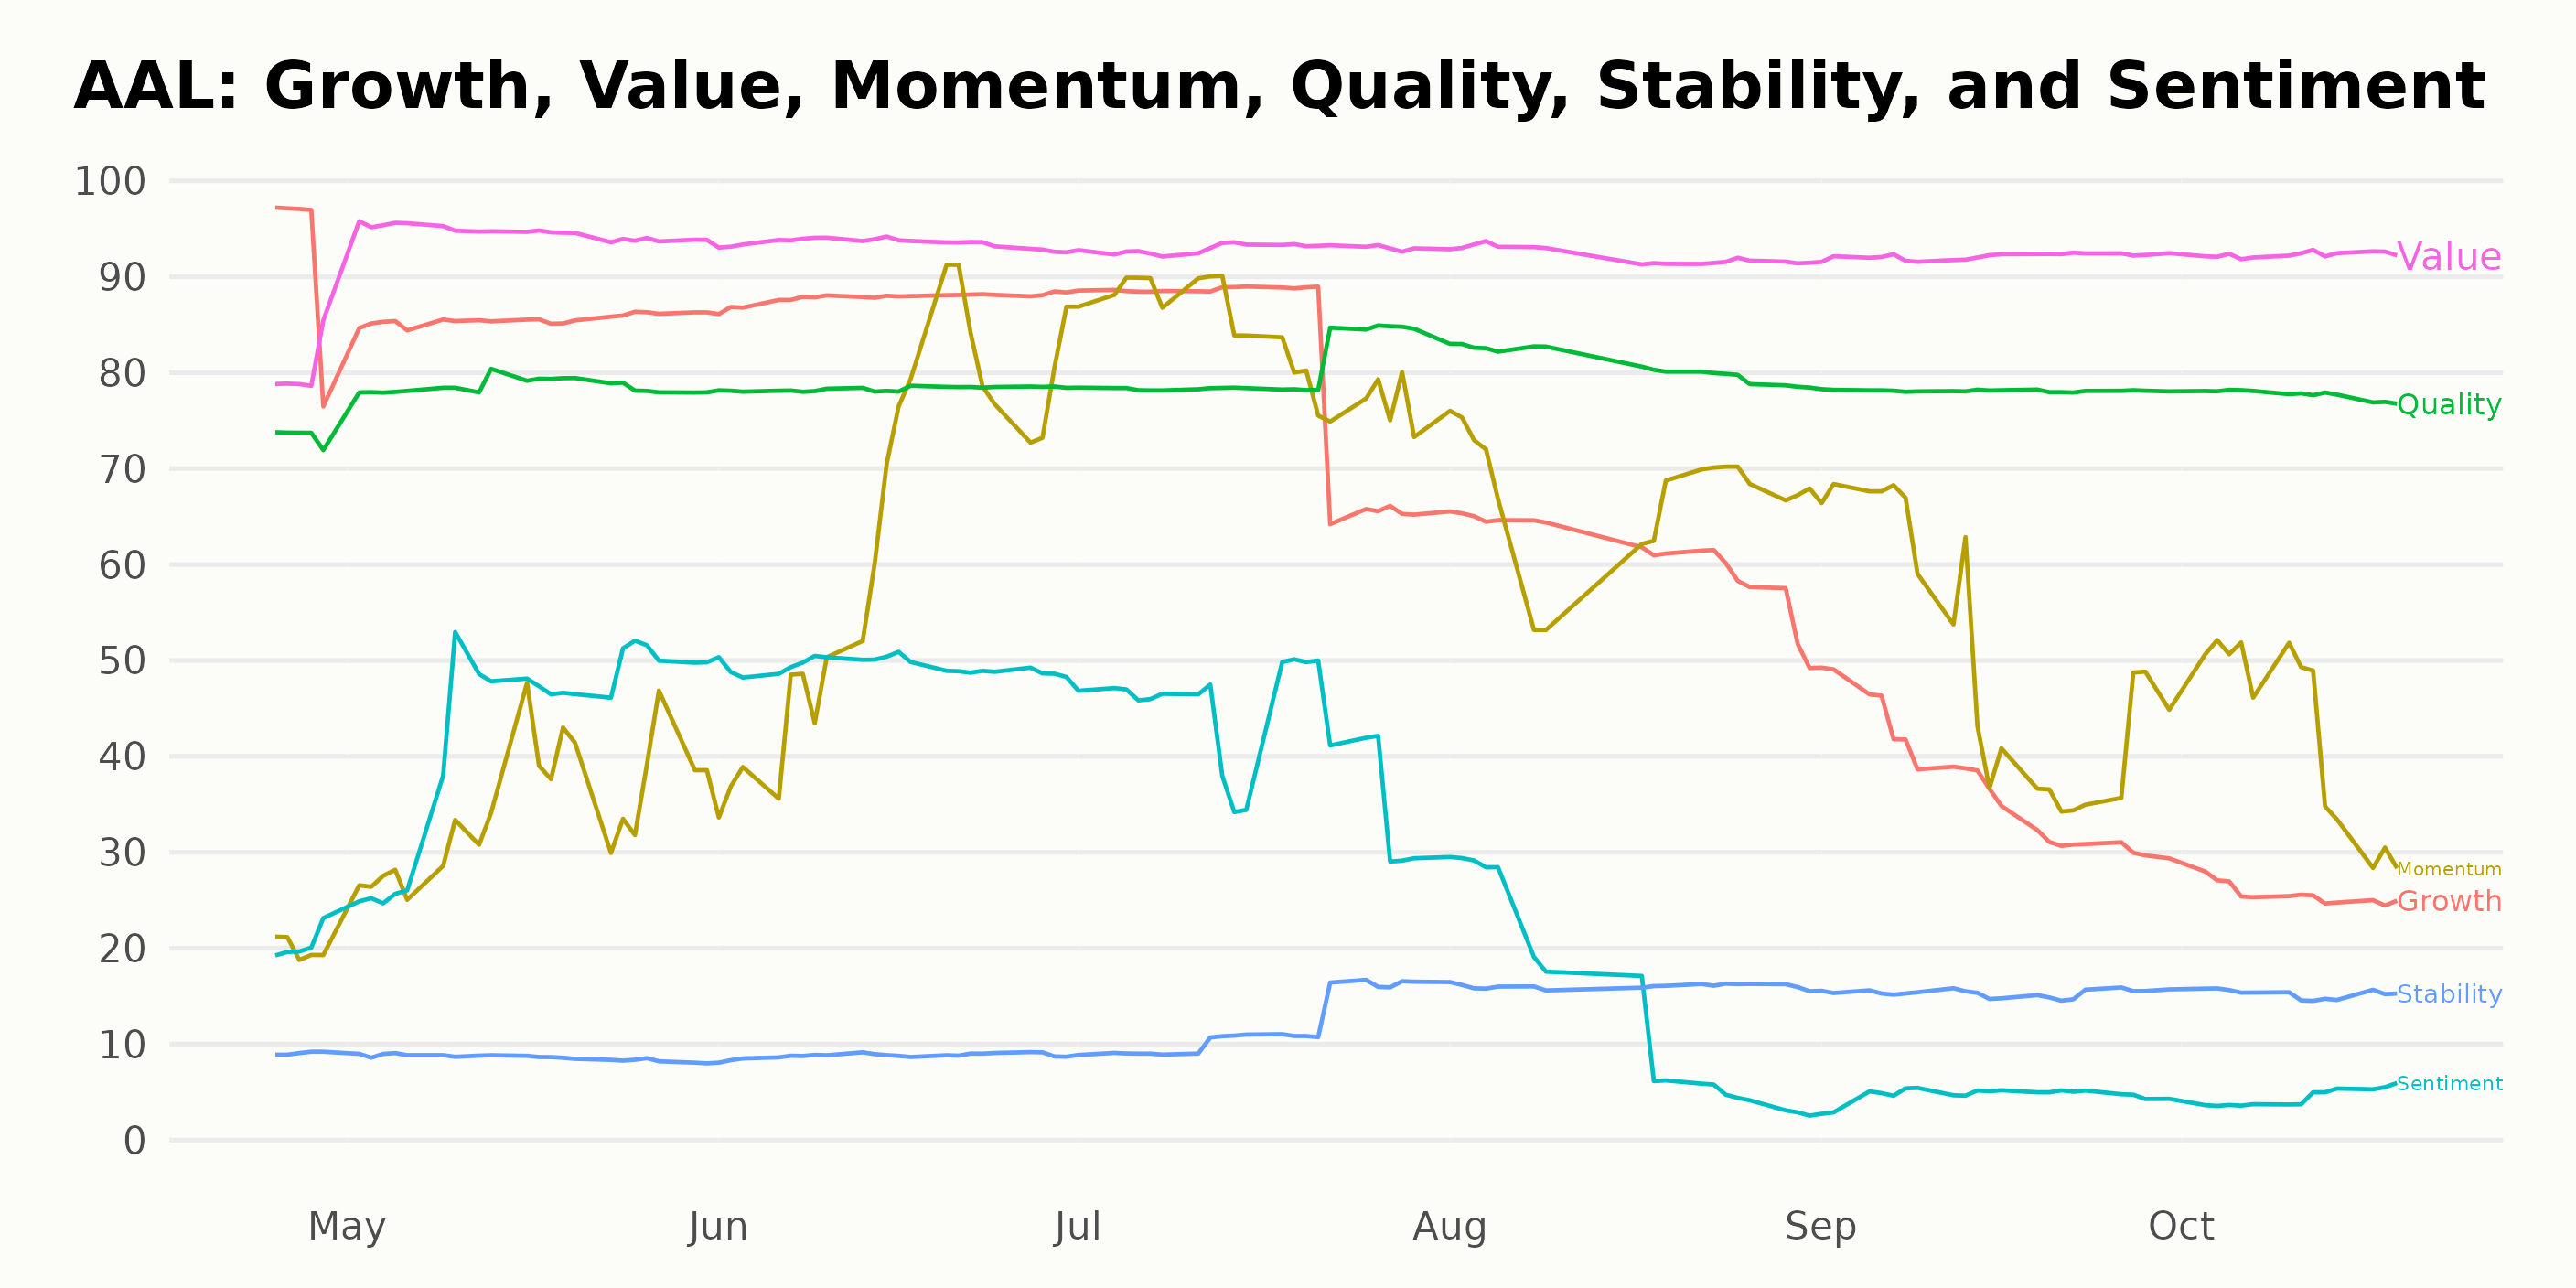
Based on the provided data, the three most noteworthy POWR Ratings dimensions for AAL are Growth, Quality, and Value, with Value consistently scoring the highest across different dates. Let's dive deeper into each one of these.
Growth:
From April 2023 to October 2023, Growth shows a negative trend. Starting at 93 in April 2023, this rating gradually decreases, reaching its lowest point at 26 by October 19, 2023.
Quality:
In comparison, Quality remains fairly consistent over time. This dimension starts at 73 in April 2023 and peaks at 81 by August 2023. Despite slight fluctuations, Quality maintains high ratings throughout the rest of the year, ending at 78 by October 2023.
Value:
Finally, Value is the standout performer. It consistently scores highest among the three dimensions throughout the period, starting at 80 in April 2023, peaking at 95 by May 2023, and remaining solid at 92 from July to October 2023. Thus, regarding the Value dimension, AAL holds a strong position throughout 2023.
It's clear that while Growth shows a decrease, Quality stays relatively stable, and Value remains highly rated across the examined period. These trends provide valuable insight into the performance of AAL.
How does American Airlines Group Inc. (AAL) Stack Up Against its Peers?
Other stocks in the Airlines sector that may be worth considering are Cathay Pacific Airways Limited (CPCAY), Air Canada (ACDVF), and Singapore Airlines Limited (SINGY) - they have better POWR Ratings. Click here to explore more Airlines stocks.
What To Do Next?
43 year investment veteran, Steve Reitmeister, has just released his 2024 market outlook along with trading plan and top 11 picks for the year ahead.
AAL shares fell $0.03 (-0.26%) in premarket trading Friday. Year-to-date, AAL has declined -9.98%, versus a 12.74% rise in the benchmark S&P 500 index during the same period.
About the Author: Anushka Dutta

Anushka is an analyst whose interest in understanding the impact of broader economic changes on financial markets motivated her to pursue a career in investment research.
The post American Airlines (AAL): Analyzing the Airliner’s Recent Stock Performance appeared first on StockNews.com